Figure 6.
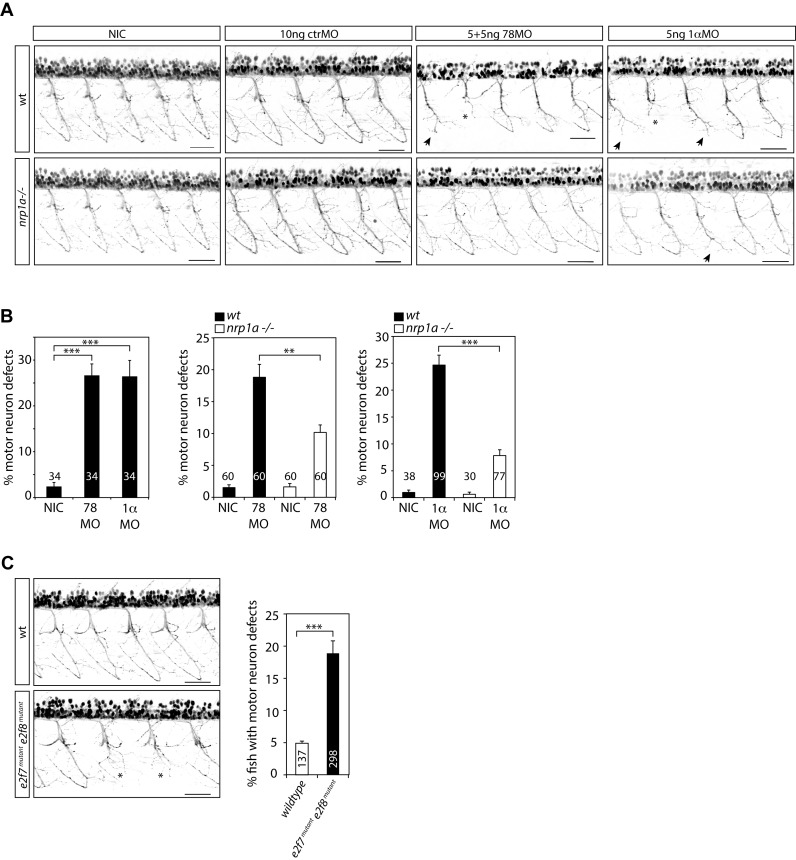
The HIF1α-E2F7 complex regulates MN development in an NRP1-dependent manner. (A) Confocal images of MN in the trunk regions above the yolk sac extension of Tg(nrp1a:gfp)js12 zebrafish at 48 hpf. Zebrafish embryos were non-injected (NIC: non-injected control), or injected with e2f7/8 (5 + 5 ng), hif1ab (5 ng), or control (10 ng) MO. Stunted MN are indicated with an asterisks, truncations resulting in the absence of the hinge are indicated with an arrow. Black bar presents 50 μM. (B) Quantification of MN defects in all MN analyzed, as described under (A). Left graph shows quantification of MN defects in e2f7/8 MO or hif1ab MO injected or non-injected wild-type Tg (nrp1a:gfp)js12 zebrafish. The two right graphs show quantification of MN defects in e2f7/8 MO or hif1ab MO injected, and non-injected wild-type (black bars) or nrp1ahu10012 mutant (white bars) Tg(nrp1a:gfp)js12 zebrafish. The numbers in the graphs present the number of analyzed zebrafish (obtained from at least three independent experiments). Per fish, all MN above the yolk sac extension (10–11 MN) were analyzed. (C) Analysis of MN defects in wild-type Tg(nrp1a:gfp)js12 zebrafish embryos, or in embryos obtained from crossing e2f7A207/A207; e2f8A196/A196; Tg(nrp1a:gfp)js12 zebrafish with e2f7A207/A207; e2f8WT/A196; Tg(nrp1a:gfp)js12 zebrafish. MN defects were analyzed in the trunk regions above the yolk sac extension at 48 hpf. Left panels show representative confocal images of analyzed MN for both groups. Graph presents quantification of the number of fish with MN defects (presented as%), analyzed in 137 wild-type, or 220 e2f7/8 mutant zebrafish embryos. All quantified data present the average ± S.E.M. compared to the indicated controls in at least three independent experiments. *P < 0.01, **P < 0.001, ***P < 0.0001.

