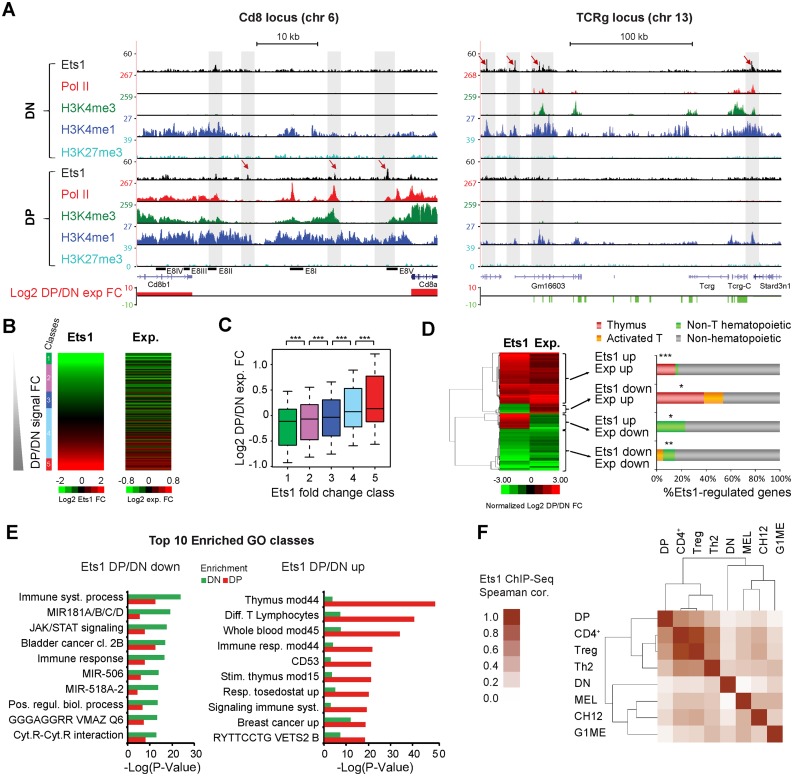
Figure 1.
Ets1 is dynamically associated with positive regulation of stage-specific genes. (A) Examples of Ets1 gain (Cd8) or loss (Tcrg) at critical T-cell genes during DN to DP transition. Genome browser screenshots of the Cd8 and Tcrg loci (left, right) showing Ets1, Pol II, H3K4me1/3, H3K27me3 ChIP-seq coverages and gene expression fold changes in DN and DP. (B) Correlation between Ets1 and gene expression fold changes. Heatmaps of increasing DP/DN Ets1 (left) and corresponding gene expression fold changes (right). (C) Significance of gene expression differences by increasing Ets1-fold change. Expression fold changes for all classes, shown as a boxplot. Significance levels for each comparison are indicated above, with 1 star denoting P < 0.05, 2 stars denoting P < 0.01 and 3 stars denoting P < 0.005. (D) Genes highly differentially regulated by Ets1 correspond to tissue-specific genes. Left: hierarchical clustering of significantly differentially regulated and Ets1 bound genes showing 4 distinct gene clusters. Right: tissue specificity of genes expressed as percentages of each cluster. Significance levels for enrichments are indicated as in (C). (E) Genes differentially regulated by Ets1 correspond to stage-specific genes. Gene ontology analysis of groups of bottom and top 1000 DP/DN enriched genes bound by Ets1 (left, right). For each group, the top 10 gene ontology classes are shown with their corresponding enrichment in the other group. (F) DN and DP Ets1 datasets correlate with Non T-cell hematopoietic and T-cell lineages, respectively. Hierarchical clustering of pair-wise Spearman correlation coefficients of Ets1 ChIP-seq tag counts from DN, DP, non T-cell hematopoietic and T-cell lineages in distal Ets1 DN + DP peaks.

