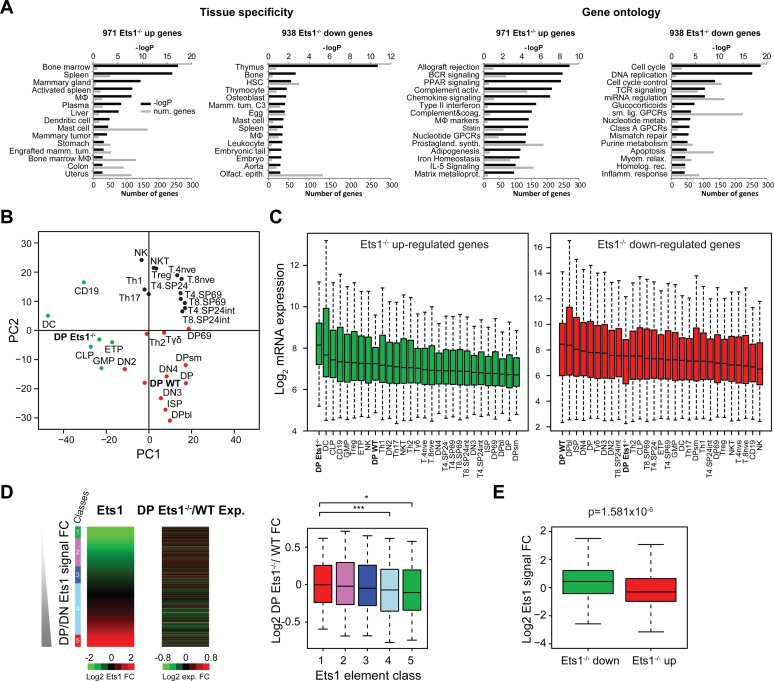
Figure 2.
Loss of Ets1 impairs the thymus and T-cell gene expression program switch. (A) Tissue-specificity and gene ontology (Wikipathways) of Ets1−/− up- and downregulated genes. –Log P-values are indicated in black; numbers of genes for each term are indicated in gray. MΦ: macrophage. (B) PCA of microarray gene expression values in DP Ets1−/− and WT datasets, as well relevant Immunological Genome datasets in T-cells and in other hematopoietic lineages with the addition of Th1, Th2, Th17 and Treg datasets from other studies in both Ets1−/− up- and downregulated genes. DP Ets1−/− and WT cells are indicated in bold. (C) Gene expression boxplots for datasets described in (B) in Ets1−/− -up (green) and -downregulated genes (red). Datasets are ranked by decreasing median expression value. DP Ets1−/− and WT datasets are indicated in bold. (D and E) Anticorrelation of WT DP/DN Ets1-fold change (D, left heatmap) and Ets1−/−/WT DP gene expression change (D, right heatmap). Ets1−/− / WT gene expression fold change values are shown as boxplots for each class of Ets1 DP/DN fold change (D, right). Significance levels for enrichments are indicated as in Figure 1C. (E) Boxplot showing Ets1 DP/DN fold change for Ets1−/− up- (green) and downregulated genes (red).

