Figure 3.
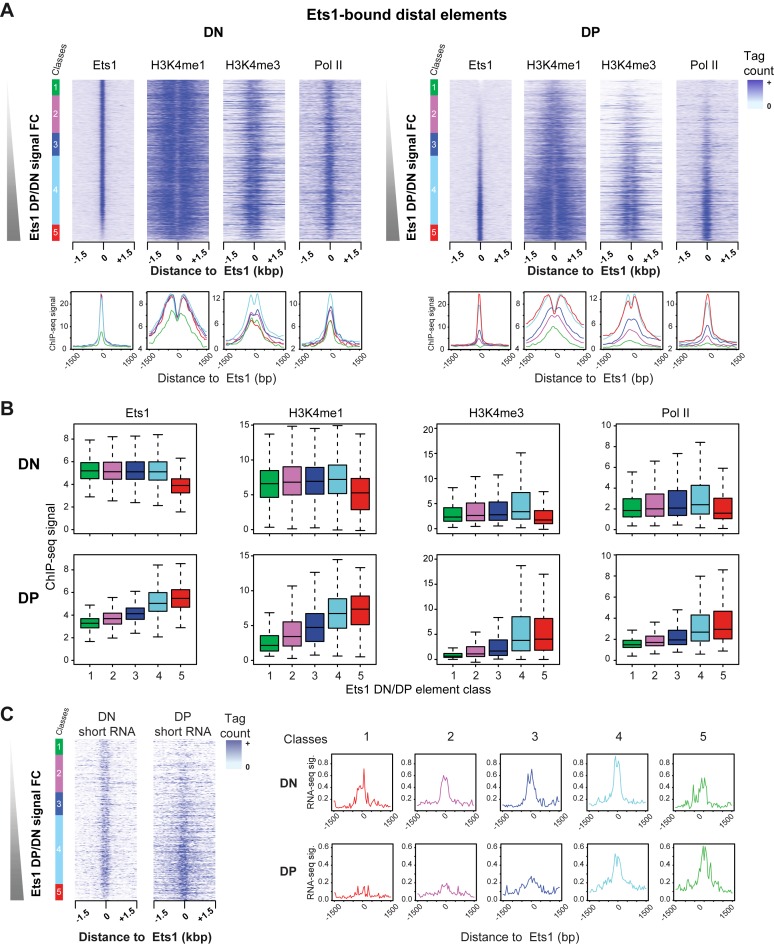
Core hallmarks of transcription activation mirror Ets1 binding between DN and DP stages. (A) Dynamic recruitment of Ets1 and core transcriptional hallmarks at distal Ets1 binding sites. Heatmaps of Ets1, H3K4me1, H3K4me3 and Pol II signals [−1500; +1500 bp] around distal Ets1-bound sites sorted by increasing Ets1 DP/DN fold change (top) in DN and DP stages (left, right). Average profiles for each class is shown with its corresponding color (bottom). (B) Quantitatively differential recruitment of Ets1 and core transcriptional hallmarks at distal Ets1 binding sites. Boxplots of signals for each mark for all classes are shown in both DN and DP. (C) Mirroring of short RNA signals and Ets1-fold change. Left: heatmaps of DN and DP short RNA-seq tag counts sorted by increasing Ets1 DP/DN fold change in distal Ets1 DN + DP sites. Classes are indicated left of the heatmaps. Right: average profiles for all classes in DN and DP.

