Figure 5.
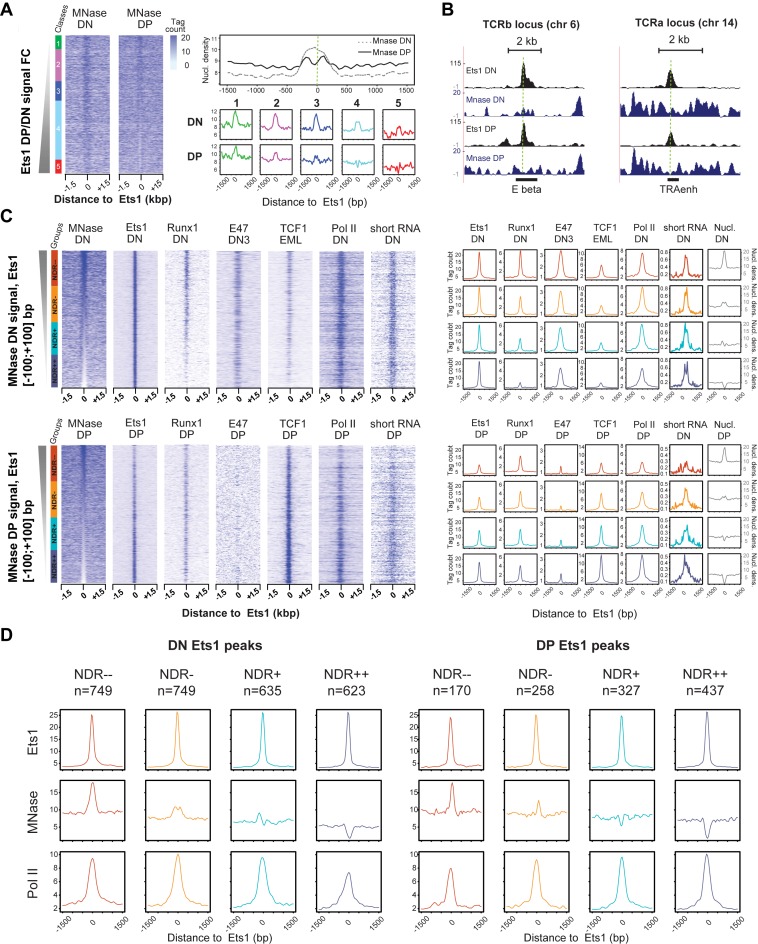
Stage-specific and co-association-mediated NDRs around Ets1-bound sites. (A) Stronger presence of NDRs in DP Ets1-bound sites. Left: MNase DN and DP heatmaps in Ets1-bound distal elements sorted by increasing Ets1 DP/DN fold change. Right: global DN and DP average profiles for MNase-seq tag counts in all Ets1 DN + DP sites (top), and DN and DP average profiles for MNase tag counts in all classes (bottom). (B) Example screenshots of DP-specific NDR in the TCRb and Tcra enhancers. (C) Stage-specific enrichments for Ets1, partner TFs as well as Pol II in NDRs and nucleosome-occupied regions (NORs) in DN + DP Ets1 peaks. Heatmaps of tag counts of MNase-seq, ChIP-seq for Ets1, partner TFs and Pol II sorted by increasing DN (top) and DP (bottom) MNase-seq. Corresponding average ChIP-seq profiles for each class of NDRs are shown on the right (colored), as well as average nucleosomal density in each case (gray). The numbers of Ets1 peaks for NDR−−, NDR−, NDR+ and NDR++ classes are indicated above each graph. (D) Altered Pol II recruitment in Ets1-bound nucleosome -occupied and -depleted regions between the DN and DP stages. Average profiles for Ets1, MNase and Pol II high-throughput sequencing of Ets1-bound classes of nucleosome occupancy levels at the DN and DP stages (left, right).

