Figure 6.
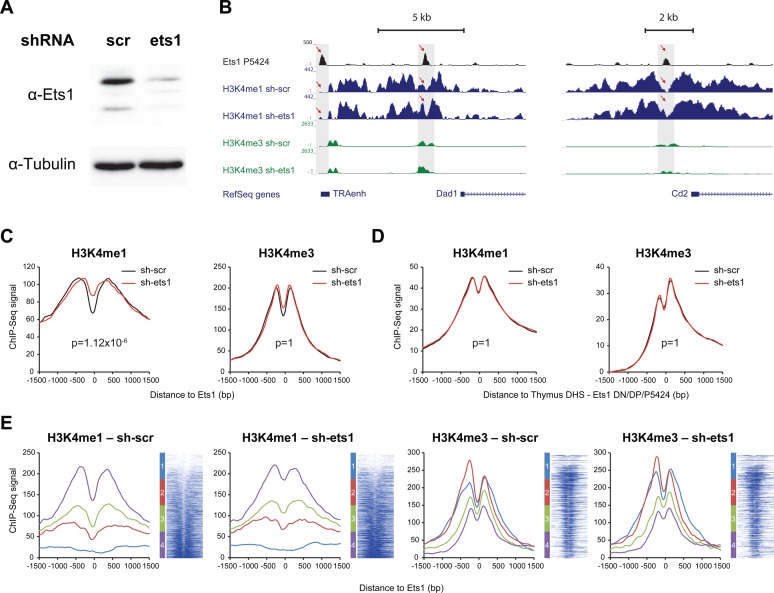
Loss of Ets1 induces chromatin remodeling via increased H3K4me1 signal genome-wide in the thymic P5424 cell line. (A) Western blot showing reduction of Ets1 protein levels following knockdown in the P5424 cell line. (B) UCSC genome browser screenshot of the Tcra (left) and Cd2 loci (right) showing increased H3K4me1 signal at the Ets1 binding site following knockdown in the P5424 cell line. (C and D) Total average profiles of H3K4me1 (left), H3K4me3 (right) with and without Ets1 knockdown (red and black, respectively) in the thymic P5424 cell line at (C) P5424 Ets1 sites and (D) control, ENCODE thymus DHS overlapping with Ets1 peaks neither in DN, DP nor P5424. P-values adjusted with Bonferroni correction for multiple testing. (E) Average profiles per class of H3K4me1 NDR and heatmaps for H3K4me1 (left), H3K4me3 (right) with and without Ets1 knockdown (red and black, respectively) in the thymic P5424 cell line at P5424 Ets1 sites, ranked by increasing P5424 sh-scr H3K4me1 signal [−500; +500 bp] around the Ets1 site. Classes of H3K4me1 NDR status are indicated left of heatmaps.

