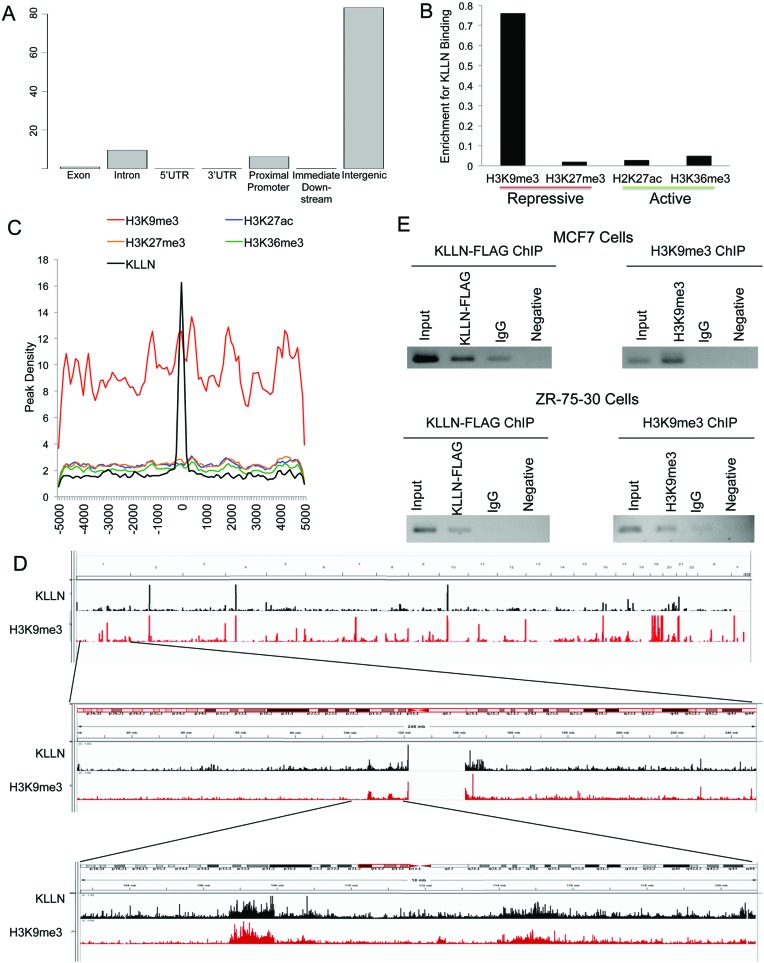
Figure 1.
Global analysis of KLLN DNA binding pattern and association with histone modifications. (A) Graph of percent of KLLN binding site locations relative to exons, introns, 5′UTRs, 3′UTRs, proximal promoters, immediate downstream region from a transcription start site and intergenic regions. KLLN binding is the highest in intergenic regions but with a substantial amount in the proximal promoters. (B) Graph of enrichment of KLLN binding in regions of H3K9me3, H3K27me3, H2K27ac and H3K36me3. KLLN binding sites in MCF7 cells have substantially more overlap with H3K9me3 compared to H3K27me3, H2K27ac and H3K36me3. (C) Graph of histone modifications centered around KLLN binding sites. There is a regional increase in the peak density for H3K9me3 around KLLN binding sites. (D) IGV screen shots of peaks from ChIP-seq data for the histone mark H3K9me3 and KLLN. The upper panel represents the entire genome, the middle panel is chromosome 1 and the bottom panel is a zoomed in region adjacent to the centromere. Overlap of peaks is observed between KLLN and H3K9me3 throughout the genome. (E) ChIP analysis of a region of overlap, chr. 21:42093265–42093385, identified in ChIP-seq data for KLLN and H3K9me3. Both FLAG-KLLN and H3K9me3 are found to bind the same region in MCF7 and ZR-75-30 cell lines. ChIP with non-specific IgG antibody was used as a control along with a PCR reaction with no DNA as another control.

