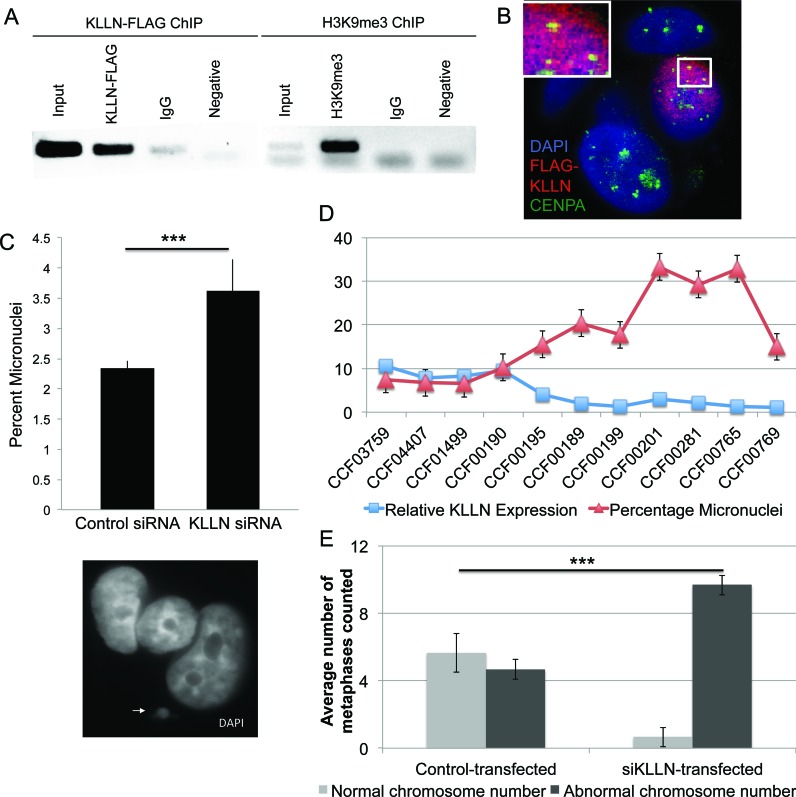
Figure 3.
KLLN localization at pericentric regions and chromosomal instability. (A) ChIP analysis of the pericentric satellite sequence for both KLLN binding and H3K9me3. ChIP with non-specific IgG antibody and a PCR reaction with no DNA used as negative controls. Overlap of KLLN and H3K9me3 seen at pericentric satellite (Sat2) regions. (B) Confocal analysis of FLAG-KLLN transfected MCF7 cells stained with DAPI (blue), nuclear staining, CENP-A (green), a centromere-binding protein and FLAG (red), for FLAG-KLLN fusion protein. In the nucleus with a successful transfection of FLAG-KLLN indicated by the red staining, co-localization of CENP-A and FLAG-KLLN can be visualized as yellow staining. KLLN localizes at the pericentric region. (C) Graph of micronuclear frequency after siRNA-based knockdown with KLLN in MCF7 cells. Micronuclei are significantly increased (P = 0.014) with KLLN knockdown. The white arrowhead indicates a micronucleus next to a regular nucleus. (D) Graph of micronuclear frequency versus KLLN expression in 11 LCL samples. KLLN expression for sample CCF00769 was set at 1 and expression of all other samples were expressed as a value relative to this sample. Micronuclei frequency is significantly increased (P = 0.003) with reduced KLLN expression (<5). (E) Graph for analysis of chromosome number as a marker of chromosomal instability after siRNA-based knockdown of KLLN in MCF10A cells. Increased number of nuclei with an abnormal chromosome number indicates chromosomal instability after KLLN knockdown (P = 0.0001).

