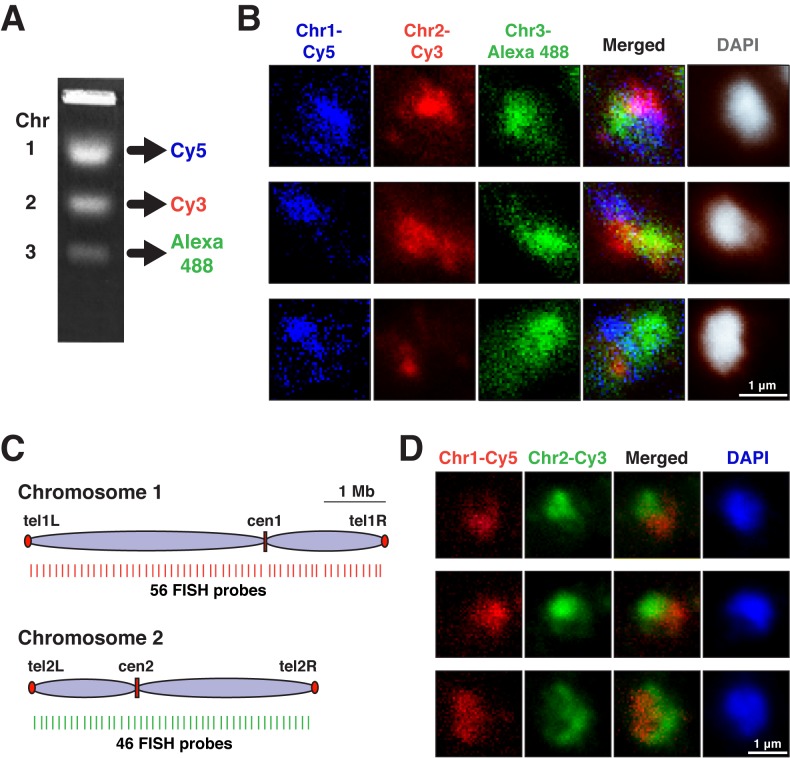
Figure 3.
Visualization of the entire fission yeast chromosomes. (A) The fission yeast chromosomes were separated by PFGE and purified from agarose gel. The recovered DNA was used for preparation of chromosome-specific FISH probes. (B) The fission yeast chromosomes were co-visualized using PFGE-derived FISH probes. (C) Positions of FISH probes prepared by PCR amplification. Red and green bars indicate positions of DNA fragments prepared by PCR. PCR-derived DNA fragments were mixed to generate chromosome-specific FISH probes. (D) The fission yeast chromosomes 1 (red) and 2 (green) were co-visualized using PCR-derived FISH probes.

