
Figure 5.
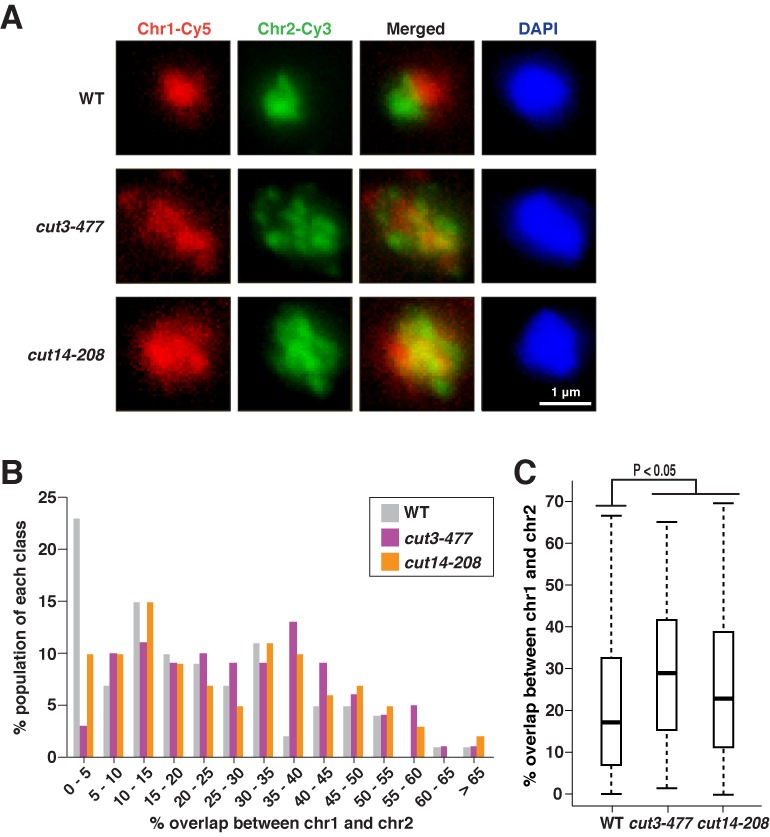
Chromosome territories compromised in condensin mutants. (A) The chromosomes 1 and 2 were co-visualized in WT, cut3–477 and cut14–208 condensin mutant cells. Cells are cultured as described in Figure 2A, and painting FISH was performed with PCR-derived probes. (B) The percentage overlap between the chromosomes 1 and 2 was estimated in the WT and condensin mutants. The observed percentage overlap was assigned to one of 5% bins. (C) The %overlap between the chromosomes 1 and 2 in the indicated strains was represented as boxplots (Figure 4C).