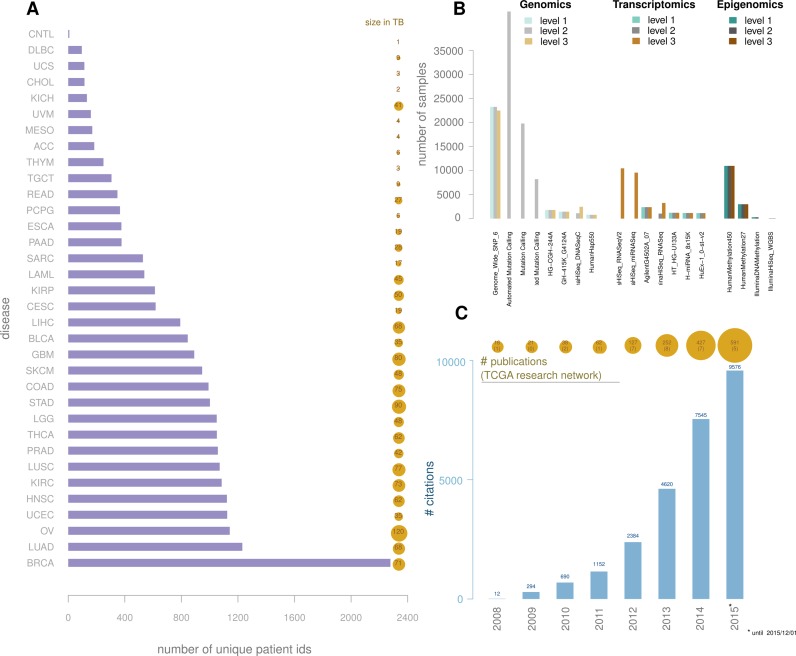
Figure 1.
TCGA data overview. (A) bars represent number of patients by disease; bubbles represent the available data size in TB by disease; (B) number of samples by platform and by level, grouped by type: genomic, transcriptomic and epigenomic. (C) Barplot: number of citations for TCGA papers. Bubble plot: number of TCGA papers, in parenthesis the number of papers published by the TCGA Research Network. Source: Scopus search for 'TCGA', adding TCGA Research Network papers that were not found during this search.

