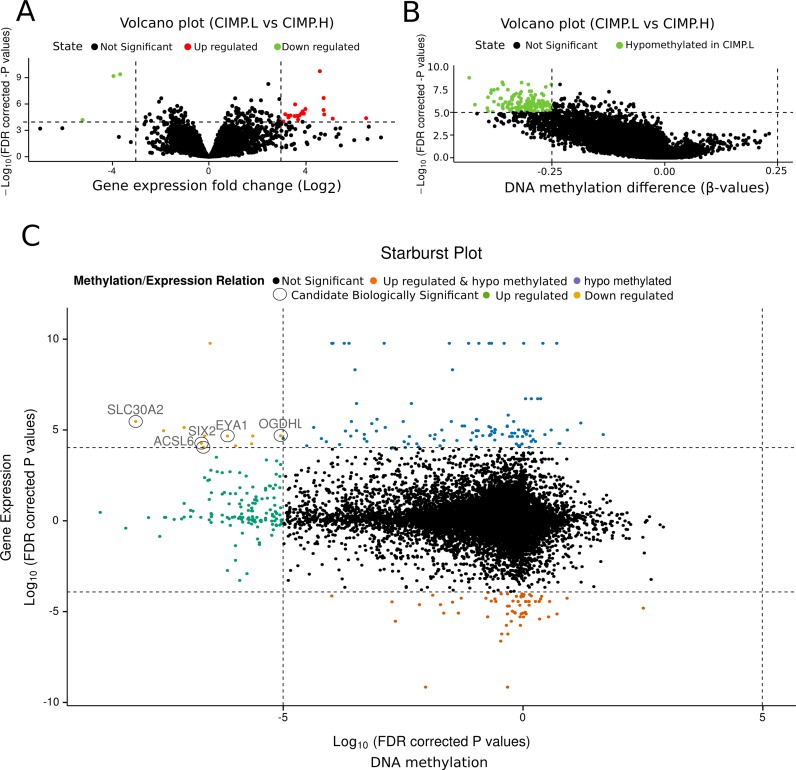
Figure 5.
Case study n.3 Integrative analysis of gene expression and DNA methylation data from COAD disease, comparing groups CIMP.L and CIMP.H. (A) Expression volcano plot: fold change of expression data versus significance. (B) DNA methylation volcano plot: difference of DNA methylation versus significance. (C) Starburst plot: DNA methylation significance versus gene expression significance.

