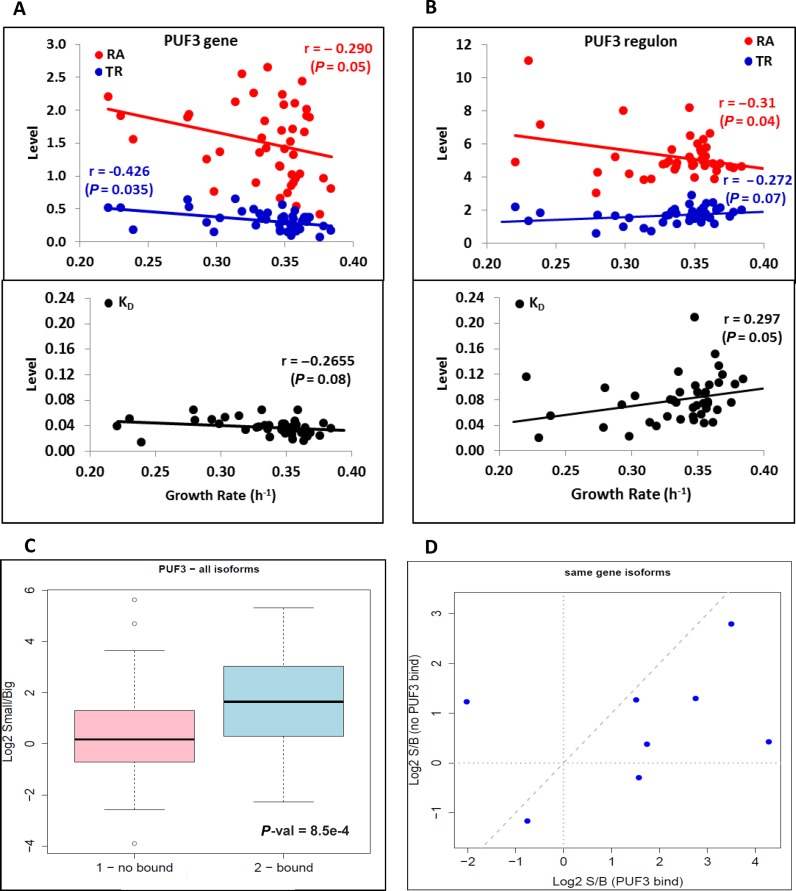
Figure 5.
Puf3-related expression changes. (A) The RA (red dots), TR (blue dots) and kd (lower panel black dots) of the PUF3 gene expression, along with the data set from Sun et al. (26), are shown. There is a statistically significant decrease in RA with the GR due to a drop in the TR given that kd even has a slight non-significant negative slope. (B) PUF3-post transcriptional regulon genes (68) show a drop in the mRNA levels (red) due to kd increasing (mRNA destabilization). (C) Boxplot comparing the relative mRNA amount of genes that contain annotated Puf3-binding sites in their 3′ UTR. The alternative polyadenylation isoforms that contain Puf3-binding sites (bound, in blue) are significantly enriched in small microcolonies compared to the isoforms, excluding Puf3-binding sites (not bound, in pink). (D) Analysis of the eight gene members of the Puf3 regulon, which presented simultaneously alternative polyadenylation isoforms both with and without Puf3-binding sites in both small and big microcolonies (minimum of 10 reads). Seven genes presented greater enrichment in the small subpopulation for those isoforms that contain Puf3-binding sites.

