Figure 3.
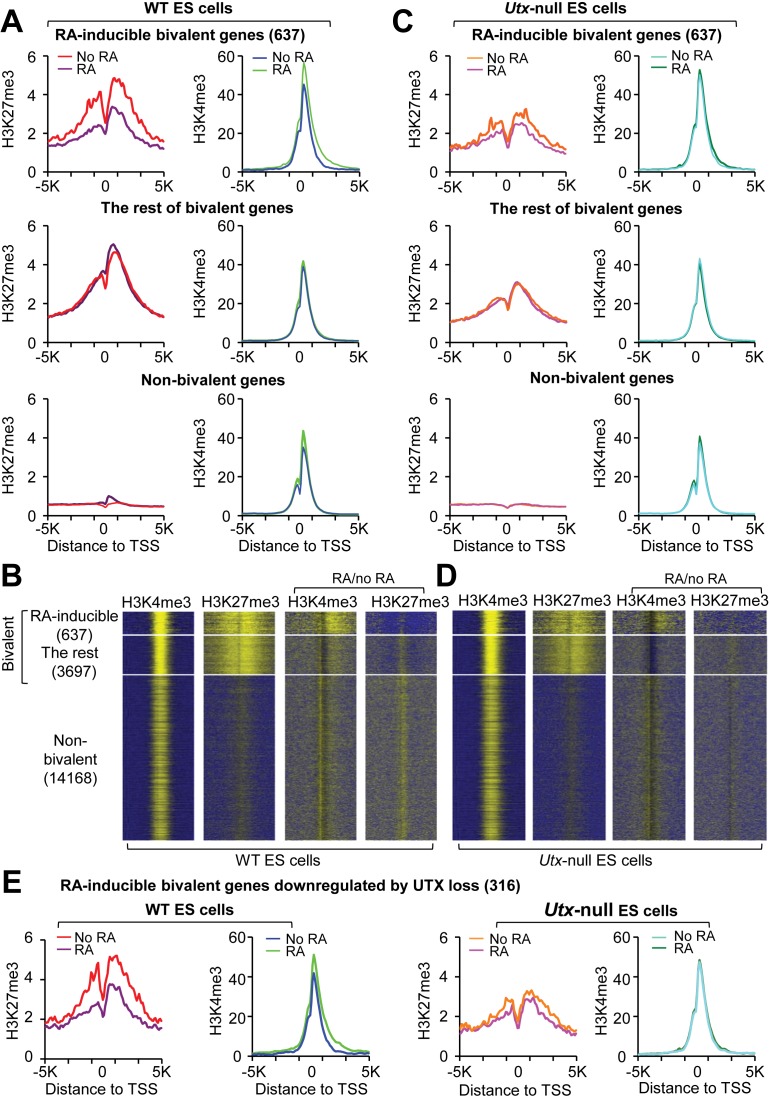
UTX resolves the bivalency of many RA-inducible bivalent genes during RA-driven differentiation of mouse ESCs. (A and C) Comparison of average ChIP-Seq reads densities for H3K4me3 and H3K27me3 between RA-treated and untreated WT cells (A) and between RA-treated and untreated Utx-null cells (C). The average values of three biological replicates of the 637 RA-inducible bivalent genes (top), the rest of bivalent genes (middle) and non-bivalent genes (bottom) were plotted from -5K to 5K around the transcription start site (TSS). (B and D) ChIP-Seq enrichment profiles for H3K4me3 (first column) and H3K27me3 (second column) levels and for RA-induced changes in H3K4me3 (third column) and H3K27me3 (fourth column) levels in WT (B) and Utx-null (D) mouse ESCs. (E) Comparison of ChIP-Seq reads densities for H3K4me3 and H3K27me3 between RA-treated and untreated WT cells and between RA-treated and untreated Utx-null cells. The 316 RA-inducible bivalent genes downregulated by UTX loss were used.

