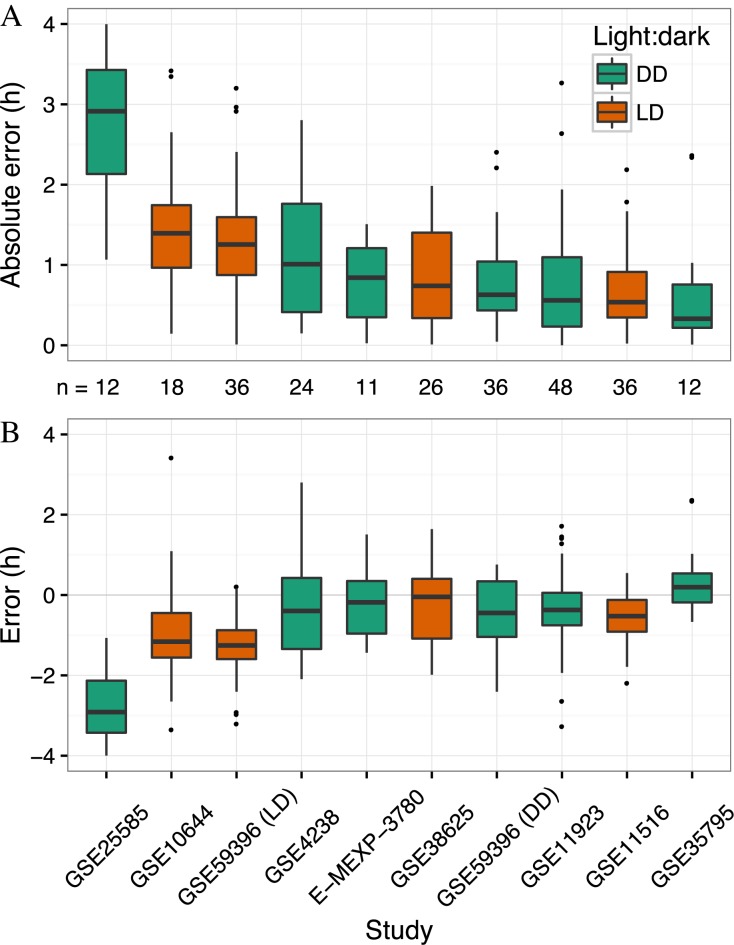
Figure 4.
Applying the multi-organ predictor to independent datasets of circadian gene expression in wild-type mice. Boxplots of (A) absolute error and (B) error for each independent dataset. GSE59396 contains samples from DD and LD, so those are analyzed separately. Datasets are sorted by median absolute error. The number of samples in each dataset is indicated between panels A and B. For ease of visualization, one outlier has been omitted from each of GSE38625, GSE59396 (DD) and GSE59396 (LD). All points, including outliers, are visible in Supplementary Figure S7.

