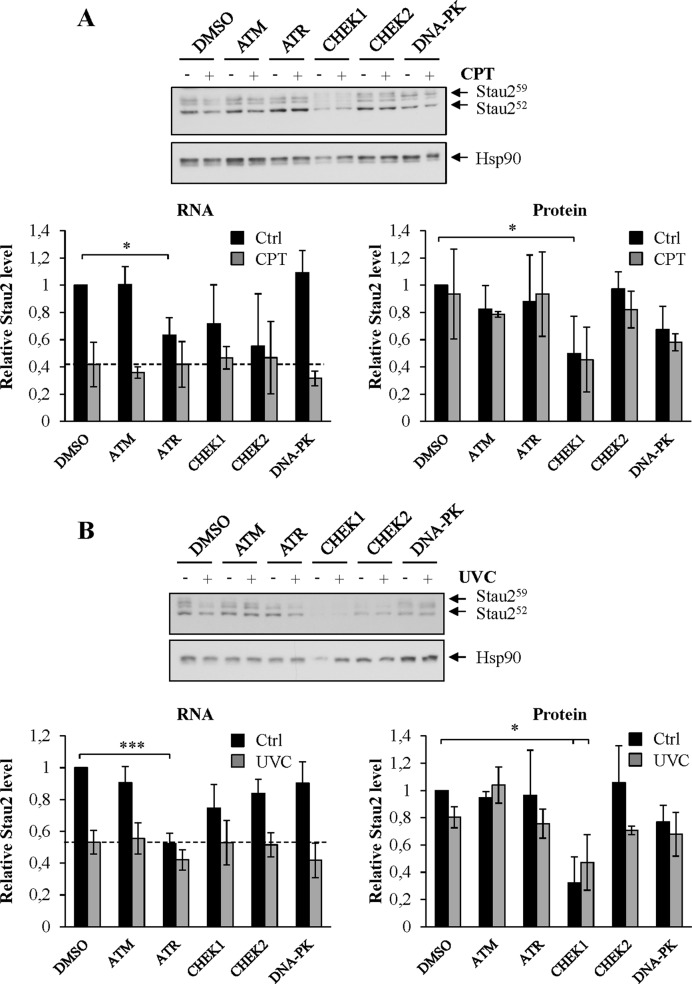
Figure 3.
Signaling pathways involved in Stau2 downregulation. HCT116 cells were incubated in the presence of different kinase inhibitors for 4 h, then with the inhibitors and CPT (300 nM) (A) for another 4 h, or (B) incubated in the presence of different kinase inhibitors for 4 h, then irradiated at 10 J/m2 and re-incubated for 4 h in the presence of inhibitors. Stau2 protein expression was analyzed by western blotting while Stau2 mRNA levels were quantified by RT-qPCR. Stau2 expression was normalized to that of Hsp90 protein or GAPDH mRNA, the ratio in DMSO-treated cells without inhibitors being fixed to 1. Data represent the means and standard deviation of three independently performed experiments. Statistical analyses (Student's t-test) are indicated when significant. ***P-value ≤ 0.001; *P-value ≤ 0.05. DMSO, dimethyl sulfoxide; ATM (20 μM); ATR (20 μM); CHEK1 (20 μM); CHEK2 (20 μM); DNA-PK (10 μM).

