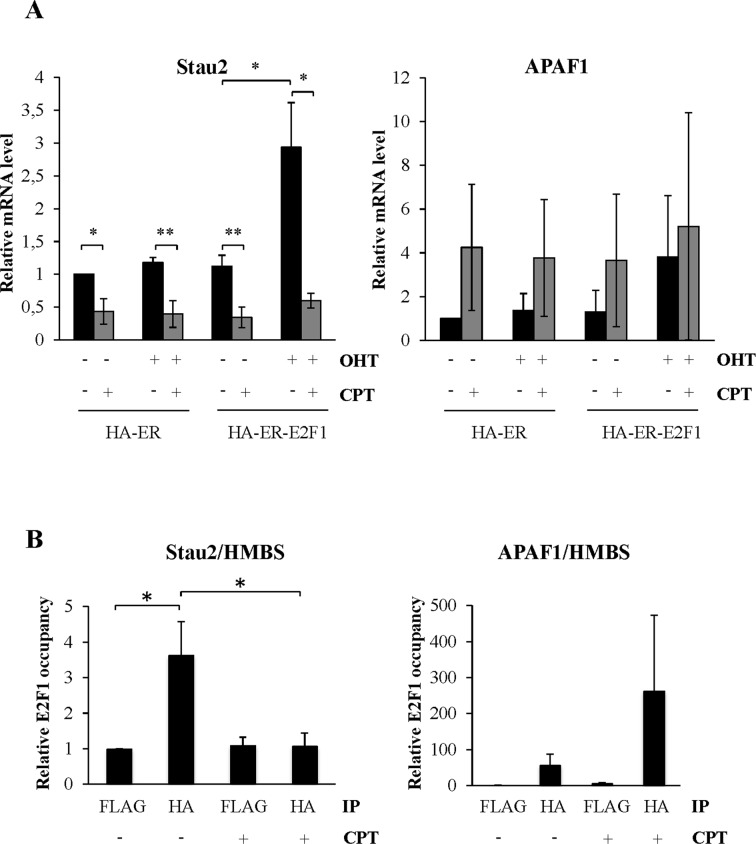
Figure 8.
CPT displaces E2F1 from the Stau2 promoter. (A) HCT116 cells were transfected with plasmids coding for HA-ER or HA-ER-E2F1 as described in Figure 6A. Cells were further incubated in the absence or presence of CPT (300 nM) for 24 h. Expression of Stau2 mRNA and as control of APAF1 was analyzed by RT-qPCR and normalized on that of GAPDH mRNA. Expression in the absence of OHT, E2F1 (ER -OHT) and CPT was arbitrarily normalized to 1. Expression data represent the means and standard deviation of three independently performed experiments. Statistical analyses (Student's t-test) are indicated when significant. *P-value ≤ 0.05; **P-value ≤ 0.01. Note that similar profiles of APAF1 expression were observed in the three experiments although the levels of APAF1 induction varied from one experiment to the others. (B) ChIP assay. HA-ER-E2F1-expressing cells were incubated in the presence or absence of OHT (500 nM) for 24 h and then treated or not with CPT (300 nM) for 3 h. DNA was immunoprecipitated with anti-HA or anti-FLAG (as control) antibodies. Resulting DNA was qPCR-amplified with primers located in the Stau2 promoter as well as in the APAF1 promoter as positive control and HMBS as negative control. Ratios of the amount of immunoprecipitated DNA in the Stau2 or APAF1 promoters over that in the control region were calculated. Data represent the ratios of E2F1 occupancy in HA-ER-transfected cells over that in HA-ER-E2F1-transfected cells. Data represent the means and standard deviation of three independently performed experiments. *P-value ≤ 0.05.

