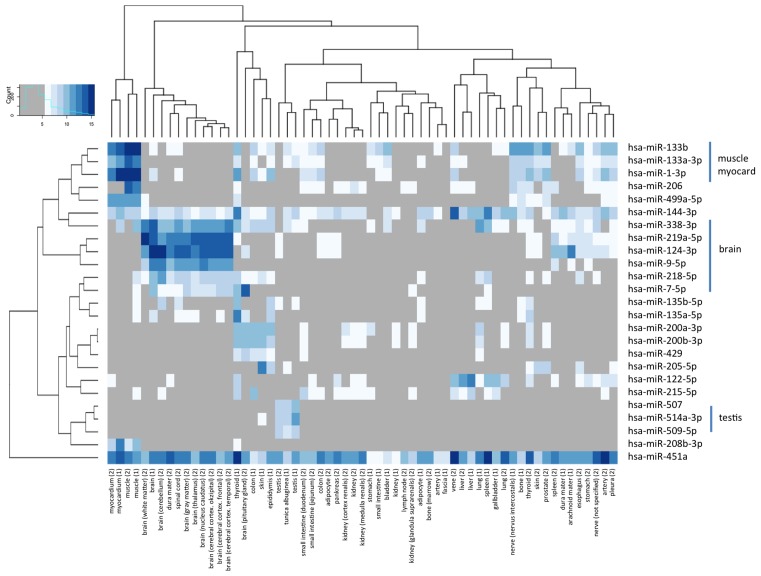
Figure 5.
Heat map for the 25 miRNAs that have TSI values of >0.85 in both bodies. Log2 transformed expression intensities of quantile normalized expression values are presented. To facilitate the interpretation of specific miRNAs in organs or organ groups low expressed miRNAs were greyed out (see also color distribution scheme in the upper left corner). The analysis highlights tissue-specific miRNAs that are exemplarily presented on the right-hand side of the plot, such as hsa-miR-1–3p that has already been described in Figure 3 as most specific miRNA overall.

