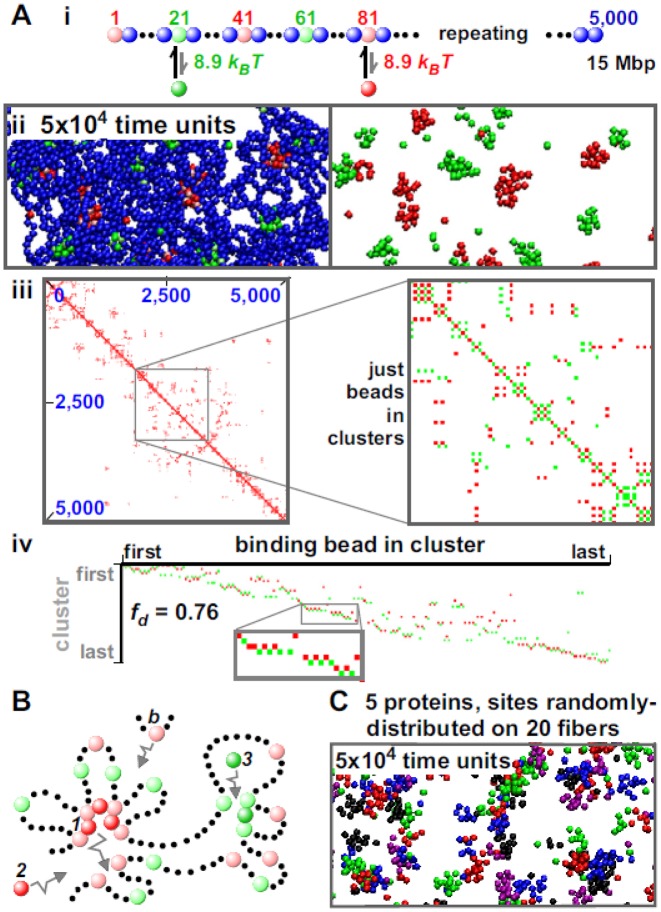
Figure 2.
Self-assembly into ‘specialized’ clusters. MD simulations were run as in Figure 1, except for differences indicated. (A) Red (n = 250) and green (n = 250) factors interact with pink and light-green beads, respectively. (i) One bead in 20 is a binding bead (with regular spacing); the colors of binding beads alternate as indicated. (ii) Final snapshot of central region (with/without chromatin); clusters contain either red or green factors. (iii) Final contact map; blocks along the diagonal are small. The zoom shows a high-resolution map involving only binding beads in clusters; contacts are scored (without binning) if bead centers lie 90 nm apart (not 150 nm), and any binding beads are treated as if they possess the color of factor binding them. Here, red and green pixels mark contacts between two pink beads, or between two light-green beads: notably, there are no mixed contacts between a light-green and pink bead (these are shown in yellow in Supplementary Figure S3). Similarly-colored pixels rarely abut in a row, as the fiber passes back and forth between differently-colored clusters. (iv) Final rosettogram (pixels correspond to binding beads, and are colored as in the contact map zoom); rows rarely contain abutting pixels of one color (reflected by a high fd). (B) How ‘specialized’ clusters form. See text. (C) Red, green, dark-blue, purple and black factors (500 of each) bind (7.1 kBT) to five sets of cognate sites scattered randomly along 20 identical fibers (each with 2000 beads representing 6 Mbp). The snapshot (taken after 5 × 10⁴ units; DNA not shown for clarity) shows that each factor tends to cluster with similarly-colored ones. See also Supplementary Figure S5.

