Figure 2.
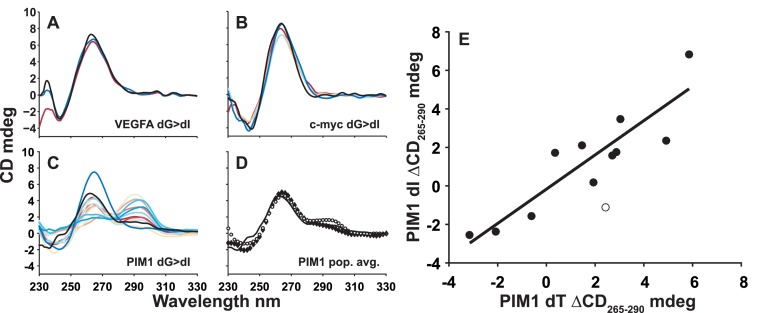
Guanine quadruplex circular dichroism (CD) spectra. CD spectra for wild type (black) and trapped mutant (colored) (A) VEGFA dG>dI, (B) c-myc Pu18 dG>dI and (C) PIM1 dG>dI GQs. In (C) and (D), the solid black line corresponds to the corrected wild-type PIM1 CD spectrum. In (D) the population-weighted average spectrum of the dG>dT and dG>dI trapped mutants are shown with filled and empty symbols, respectively. (E) Comparison of ΔCD265–290 (CD (265 nm)–CD (290 nm)) signals for dT and dI trapped mutants of the PIM1 GQ. The empty circle indicates data for the outlying PIM1-10 trapped mutant (Table 1). The line indicates the best linear fit to the 11 filled data points (R = 0.90).

