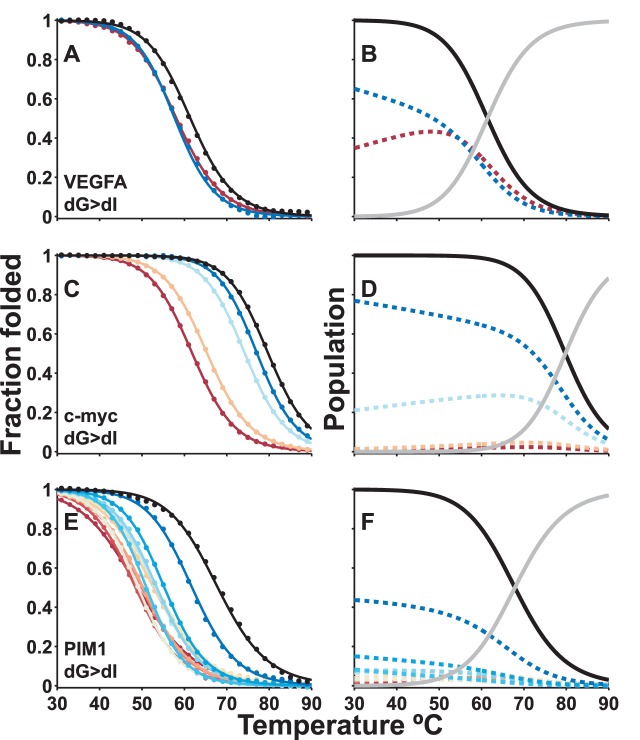
Figure 4.
Global fits of guanine quadruplex UV-Visible thermal denaturation data. Thermograms (points) and global best-fit (lines) for complete sets of wild-type and dI-containing trapped mutants of (A) VEGFA, (C) c-myc Pu18, and (E) PIM1 GQs. Black and colored lines correspond to data for the wild-type and trapped mutant GQs, respectively. The GR isomer populations (i.e. the fraction of wild-type DNA chains adopting each conformation) were extracted from the global fits (Equation 10) and are plotted in the panels immediately to the right for (B) VEGFA, (D) c-myc Pu18, and (F) PIM1 GQs. Colored dashed lines indicate the populations of each folded GR isomer, while black and grey lines correspond to the total population of the folded state and the population of the unfolded state, respectively.

