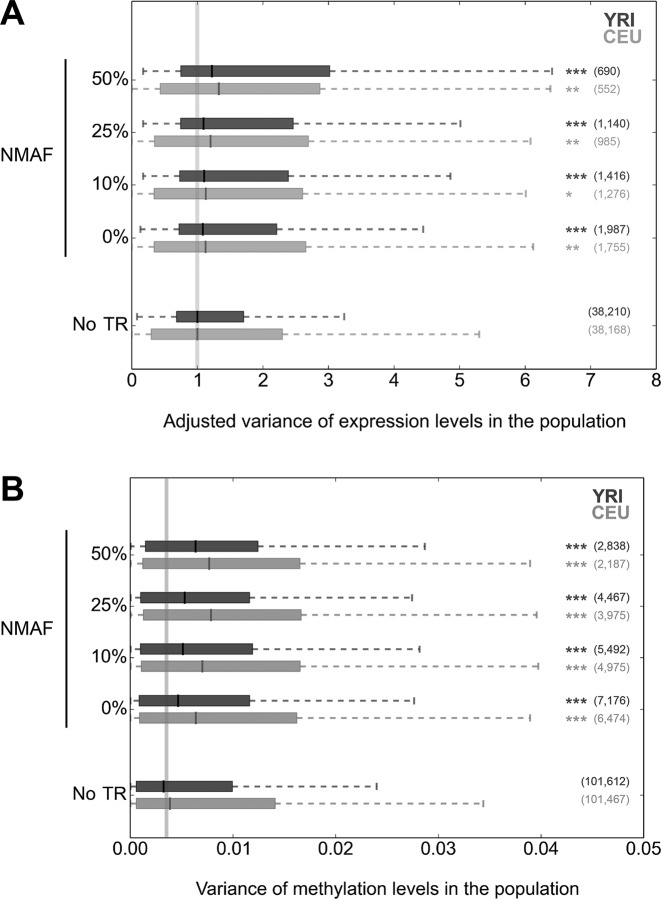
Figure 2.
Increased expression and methylation variation associated with polymorphic TRs. Distributions of variance in local (A) gene expression and (B) DNA methylation levels for CEU (light gray) and YRI (dark gray) samples based on increasing rates of TR polymorphism. NMAF refers to the non-modal allele frequency, the aggregated frequencies of all alleles other than the most common. To the right of each plot the number of genes in each category is indicated in parentheses, while asterisks indicate a significant difference of the median from the null distribution, as inferred through permutation analysis (*P < 0.05; **P < 0.01; ***P < 0.001). In the top panel (variance of gene expression), to allow for meaningful comparison in a single plot we normalized the ranges of values in CEU and YRI by dividing each by the median value of genes with no promoter-associated TR. In each figure the vertical gray line indicates the median value for the ‘No TR’ category. TR:gene and TR:CpG pairs were based on a separation of ≤1 kb.

