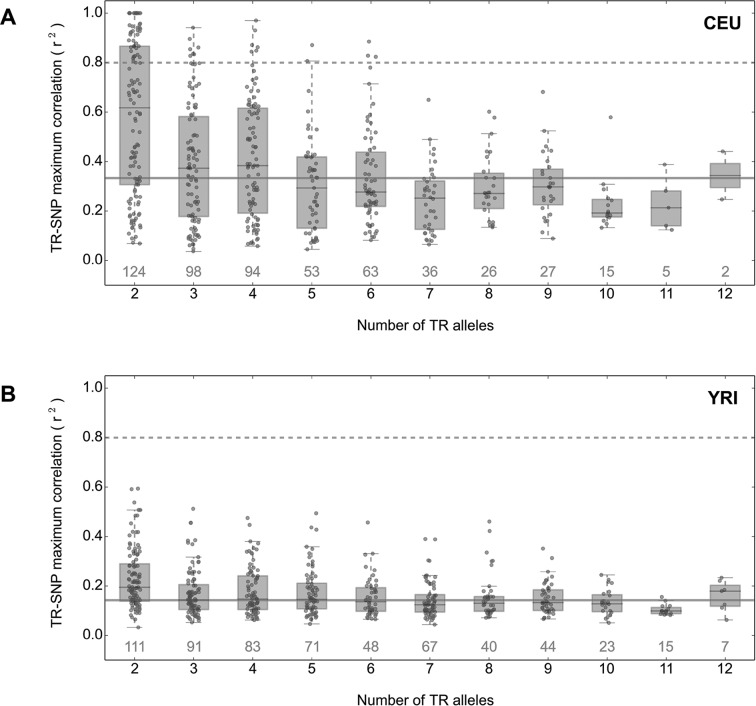
Figure 7.
Decay of LD between TRs and SNPs with TR length diversity. We calculated the LD (r2) between TRs and SNPs separated by <250kb, and after binning TRs based on the number of observed alleles (x-axis), plotted the maximum r2 observed for each TR in the (A) CEU and (B) YRI populations. The number of TRs represented in each boxplot is indicated in gray above the x-axis. Horizontal lines correspond to r2 = 0.8 (dashed) and the population median for all TRs analyzed (solid gray).

