
Figure 1. The transcription factors circuit.
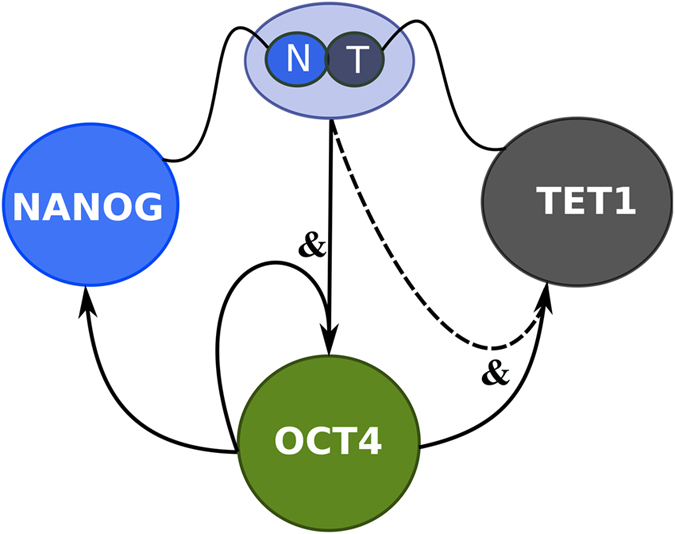
The gene network for the mutual and self-regulatory interactions between Nanog, Oct4 and Tet1. The curly lines indicate that Nanog and Tet1 interact at protein level forming a complex. The arrows indicate positive DNA regulation. The dotted arrow depicts assumed Tet1 self-interaction. The model shown in Methods is based on: Nanog and Tet1 complex regulates Oct4 and Tet1, Oct4 regulates Nanog, Oct4 and Tet1. All the gene interactions in the network are positive.