
Figure 2. Time series of Nanog, Oct4 and Tet1 for the dynamics of the gene regulatory networks under reprogramming.
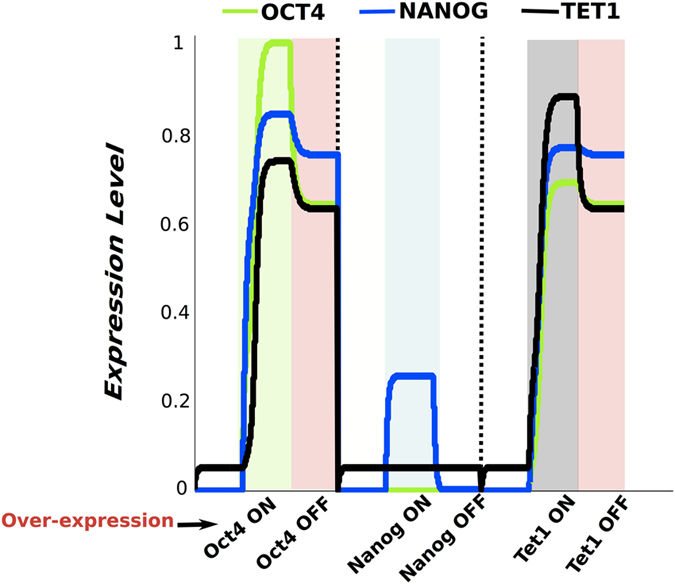
Time series of Oct4 - green, Nanog -blue and Tet1 - black for the three reprogramming scenarios: i- exogenous Oct4 present and then removed, followed by ii- exogenous Nanog expressed and then removed and iii- Tet1 over expressed and then the exogenous Tet1 is turned off. When cells are in a non-pluripotent state we use - white background, when Oct4 is over-expressed - green background, when cells are pluripotent - red background, when Nanog is over-expressed - blue background, and when Tet1 is over-expressed-grey background.