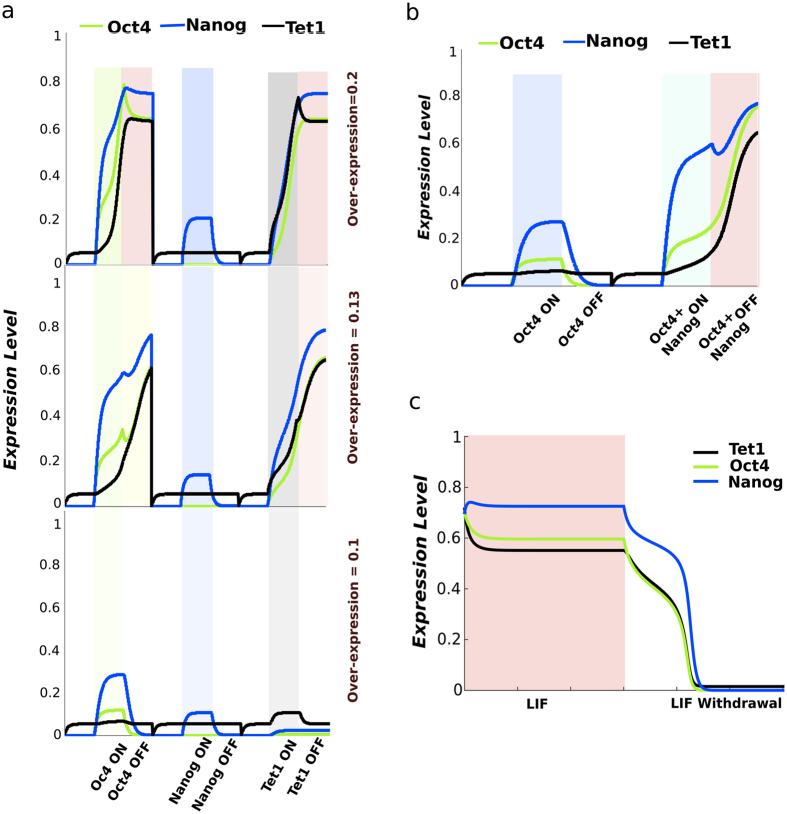
Figure 3. Time series of Nanog, Oct4 and Tet1 for various reprogramming scenarios and differentiation.
(a) Time series of the three factors when levels of factors over expression are varied: Nover = Oover = Tover = 0.1 -bottom plot, over-expression prameters values are 0.2 for middle plot and 0.3 for top plot. The yellow background corresponds to pre-iPS cells state. (b) Time series showing that addition of Nanog helps reprogramming when too low levels of exogenous Oct4 are induced. Nanog and Oct4 over-expression is depicted by cyan background. (c) Time series showing the differentiation process occurring under Lif withdrawal.

