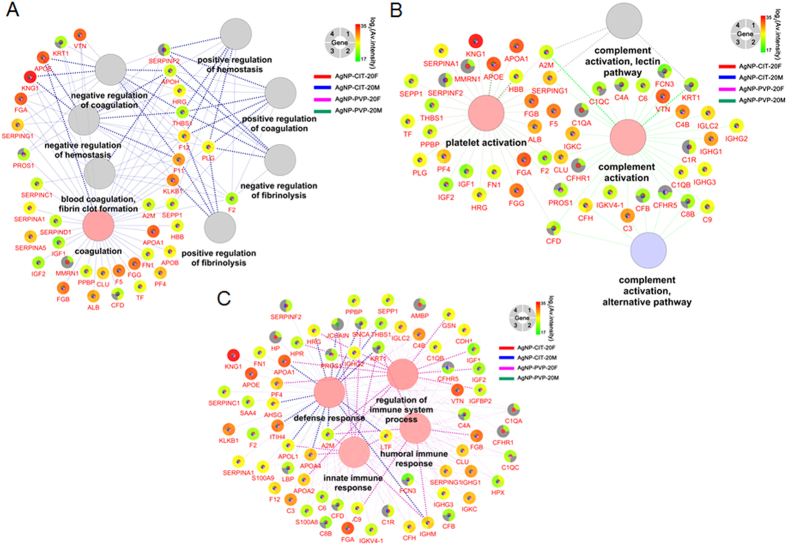
Figure 7. Proteins identified in each AgNPs corona by LC-MS were grouped by GO biological processes of coagulation, hemostasis (A), platelet or complement activation (B) and immune response (C).
The relatively intensities of each protein (shown by gene name) were displayed in the gradient color on the outer layer of the circle for four experimental groups with green to red representing low to high intensity. Experimental groups with red for AgNP-CIT-20F, blue for AgNP-CIT-20M,magenta for AgNP-PVP-20F and green for AgNP-PVP-20M were shown in the inner layer with color filled when the protein is identified in that experiment. If a protein was not found in one group, the inner layer would not have the corresponding color of experimental group and its intensity in outer layer would fill with gray for that experiment.

