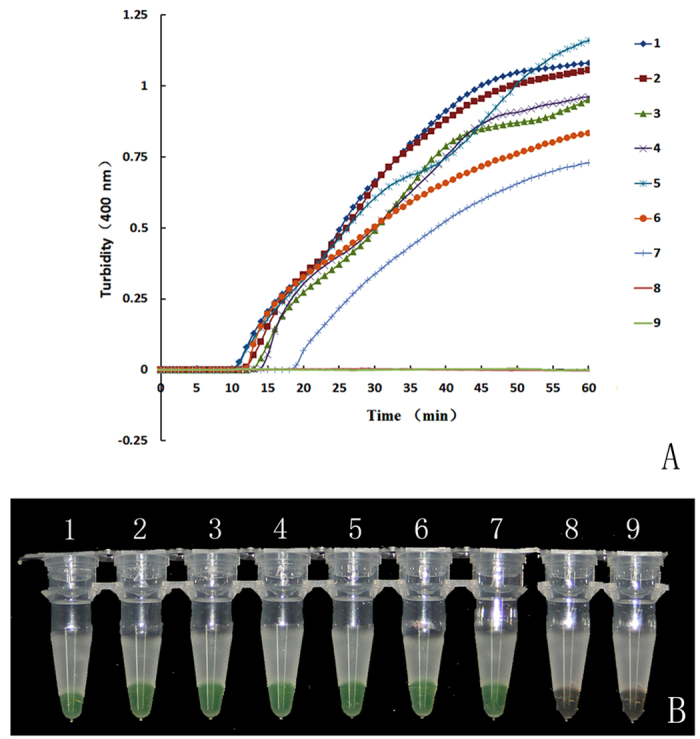
Figure 4. Sensitivity of the LAMP reaction for the detection of saffron.

The pure genomic DNA extracted from saffron was diluted in a serial 10-fold dilution. Tubes and lanes: 1, 100 ng/μl; 2, 10 ng/μl; 3, 1 ng/μl; 4, 100 pg/μl; 5, 10 pg/μl; 6, 1 pg/μl; 7, 100 fg/μl; 8, 10 fg/μl; 9, Neg. (A) Turbidity was monitored with a Loopamp real-time turbidimeter at 400 nm every 6 s; (B) A visual colour change detection method was compared. 1 μl of calcein was added to 25 μl of LAMP reaction mixture before the LAMP reaction.
