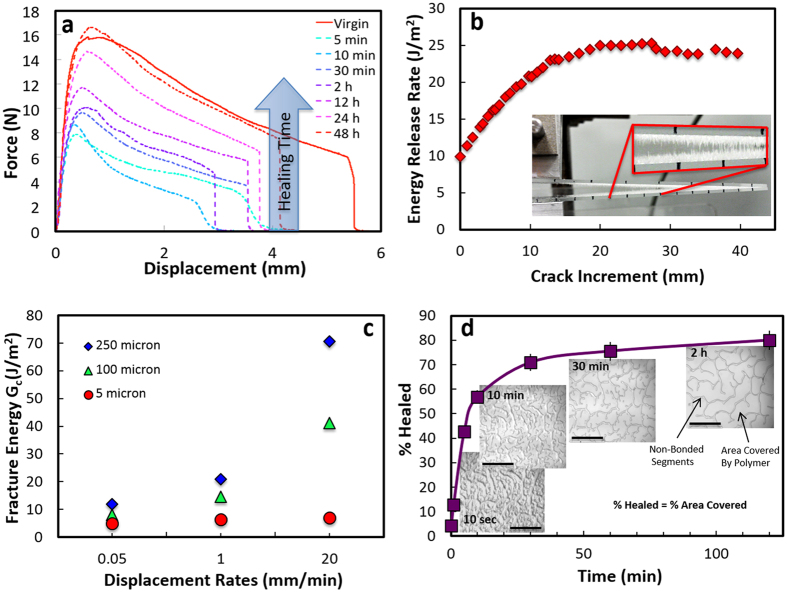
Figure 3. Mechanical analysis of the shear thickening interface.
(a) Force/displacement curves from DCB tests carried out at a constant displacement rate of 1 mm/min: as the interface heals, the strength is gradually recovered. Around 50% is recovered in the first 5 minutes with complete healing in 1–2 days. (b) Energy release rate vs. crack length. The interface exhibits a characteristic R-curve where the capillary bridges forming behind the crack tip can reach millimeter lengths, contributing to an increase in the energy as the crack length increases up to a saturation distance of ~20 mm. (c) Variation of the critical fracture energy with displacement rates and thickness of the interfacial layer. Due to the shear thickening behavior of the polymer, the energy increases with displacement speed although this increase is more noticeable for thicker layers. More plastic deformation results in higher energies for thicker layers. (d) Percentage of healed area with time. Due to its properties the polymer flows closing macroscopic defects and reforming the interface upon closure and without external pressure. Around 80% of the interface is reformed after only 2 hours, unless otherwise specified, the interfacial thickness was 20 μm. The images are optical micrographs of the interfaces taken from the top through the glass. Scale bar in the pictures is 1 mm.

