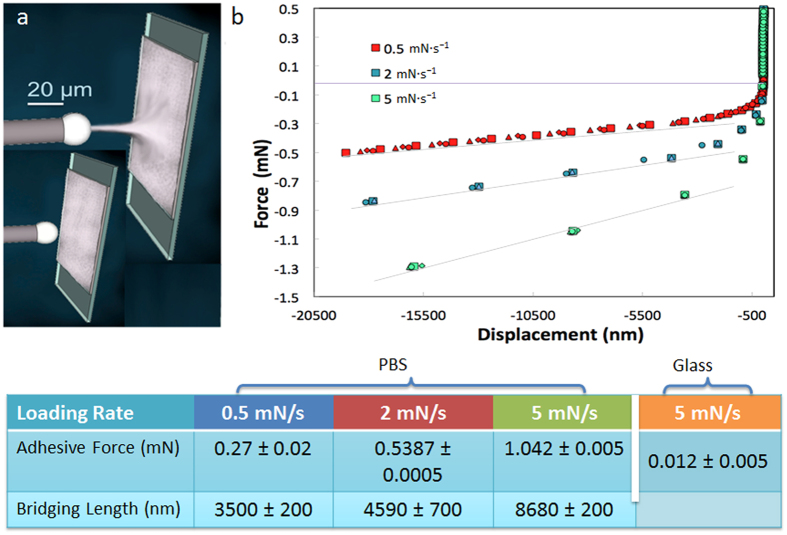
Figure 4. Single-filament testing.
(a) schematic depicting the nanoindentation test. A microscopic ceramic sphere pulls away from the polymer substrate measuring the force to stretch a single polymer bridge. The bridge reaches a critical length and then breaks. (b) The tests (performed in load control mode) show the dependence of the force curves with the pulling rates: the higher the rate, the higher the adhesive force as a result of the shear thickening behavior of the polymer. The graph reports the results repeated on the same spot for four times (shown by the four differently shaped symbols).

