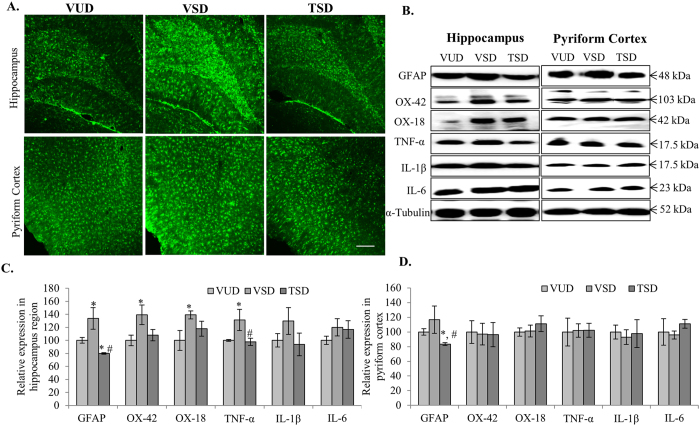
Figure 4. TCE suppressed activation of glial and microglial cells along with inflammatory cytokines, induced by acute sleep deprivation.
Immunohistochemical analysis of 35 μm thick coronal sections of brains showed reduced expression of GFAP in both hippocampus and cortex regions in TSD animals which was found to be upregulated in the same regions in VSD animals as compared to VUD. Scale bar- 200 μm (A). Further, western blot analysis showed reduced level of GFAP, iC3b complement receptor identified by OX-2 antibody, MHC-1 molecule identified by OX-18, TNF-α, IL-1β and IL-6 in hippocampus and PC regions in TSD animals as compared to VSD animals (B). Histograms represent normalized relative densitometric values of these markers obtained from three different experiments and plotted as mean ± SEM for hippocampus and pyriform cortex region respectively (C,D). ‘*’ represent statistical significant difference p < 0.05 between VUD and test groups, whereas, ‘#’ represent statistical significant difference p < 0.05 between VSD and TSD group.

