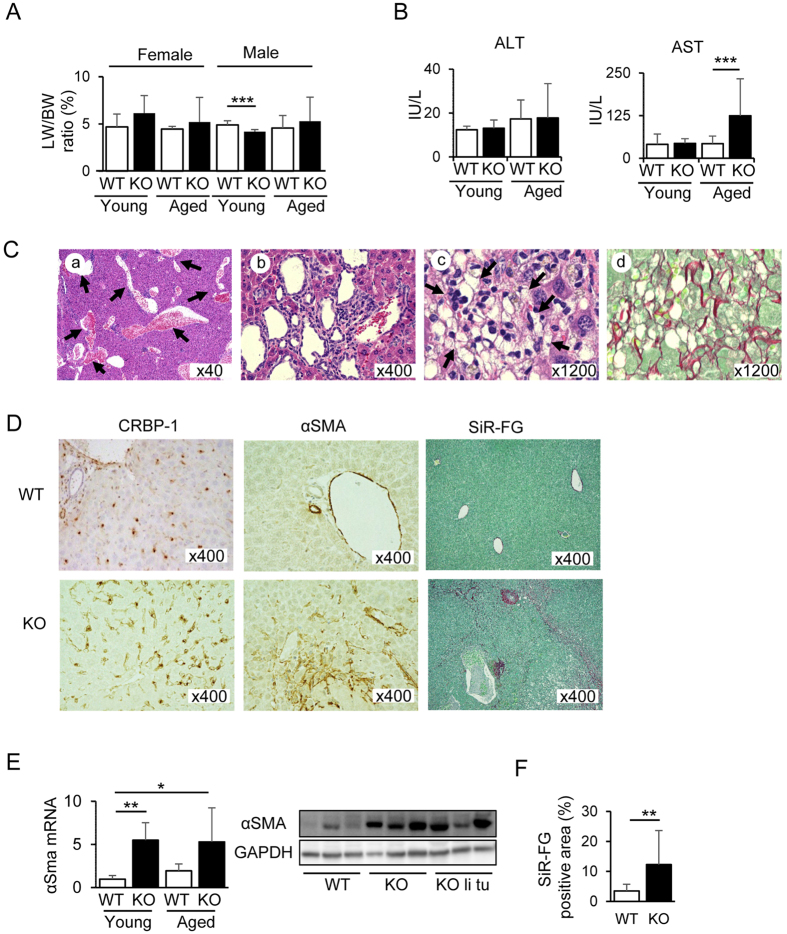
Figure 2. Liver fibrosis in Cygb−/− mice.
(A) Liver weight (LW): body weight (BW) ratio of male and female mice. (B) Alanine aminotransferase (ALT) and aspartate aminotransferase (AST) levels in the serum. (C) H&E staining of liver sections from aged KO mice showing dilation of the portal vasculature (a; arrow) hyperplasia of the bile duct (b) and hepatic stellate cells (HSC) (c; arrow) SiR-FG staining of HSC hyperplasia showing severe accumulation of collagen fibres (d). (D) Representative liver sections from aged WT and KO mice stained for cellular retinol binding protein 1 (CRBP-1) (left-panel) and α smooth muscle actin (αSMA) (middle-panel) or stained with SiR-FG (right-panel). (E) Quantitative real-time PCR analysis of αSMA expression at the mRNA level. Right inset, western blotting analysis for αSMA from homogenised liver tissues of aged WT, KO, and KO liver tumours (KO li tu). GAPDH was used as a loading control. All gels were run under the same experimental conditions. Cropped gels were used, and full-length gels are presented in Supplementary Fig. S3. (F) The Sirius red-positive area was quantified in aged WT and KO liver. Open bar, WT; closed bar, KO. Young mice: ≤12 months of age; aged mice: 13–24 months. Data represent the mean ± SD; n = 15–35 per group. *p < 0.05; **p < 0.01; ***p < 0.001.

