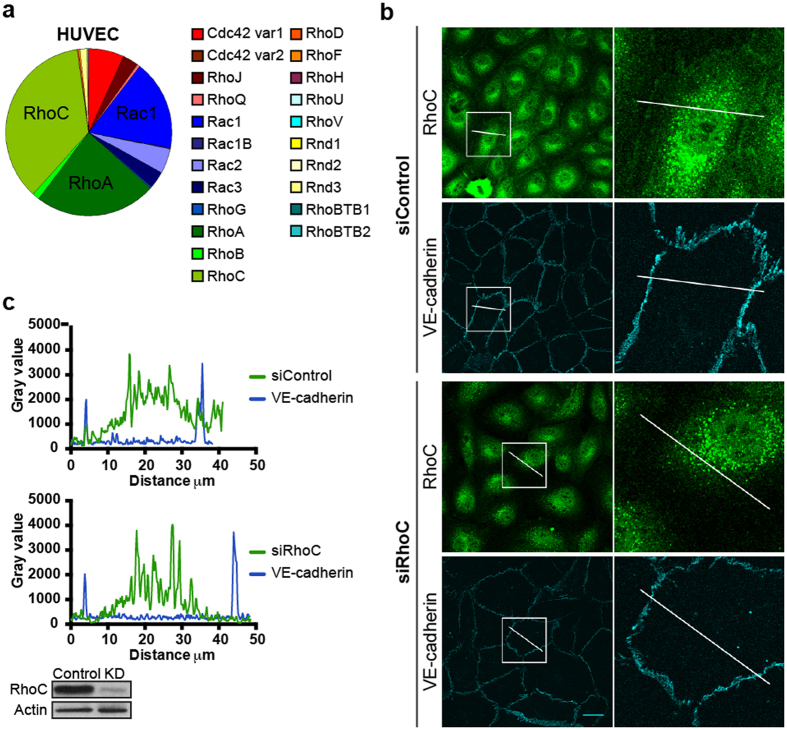
Figure 1. RhoC is highly expressed in human EC and colocalizes with VE-cadherin.
(a) RhoGTPase qPCR analysis in HUVEC. Pie chart displays mean values of 3 sequential qPCR experiments. (b) EC were transfected with siRNA control or siRhoC and stained for RhoC and VE-cadherin. Boxes show co-localization of RhoC and VE-cadherin in Control cells, but not in RhoC knockdown cells. Bar = 25 μm. (c) Gray value profile of RhoC (green line) and VE-cadherin (blue line) in siControl and siRhoC EC according to the lines present in the box selections in (b). Efficiency of RhoC Knockdown was checked on Western blot, actin was detected to control for equal loading.

