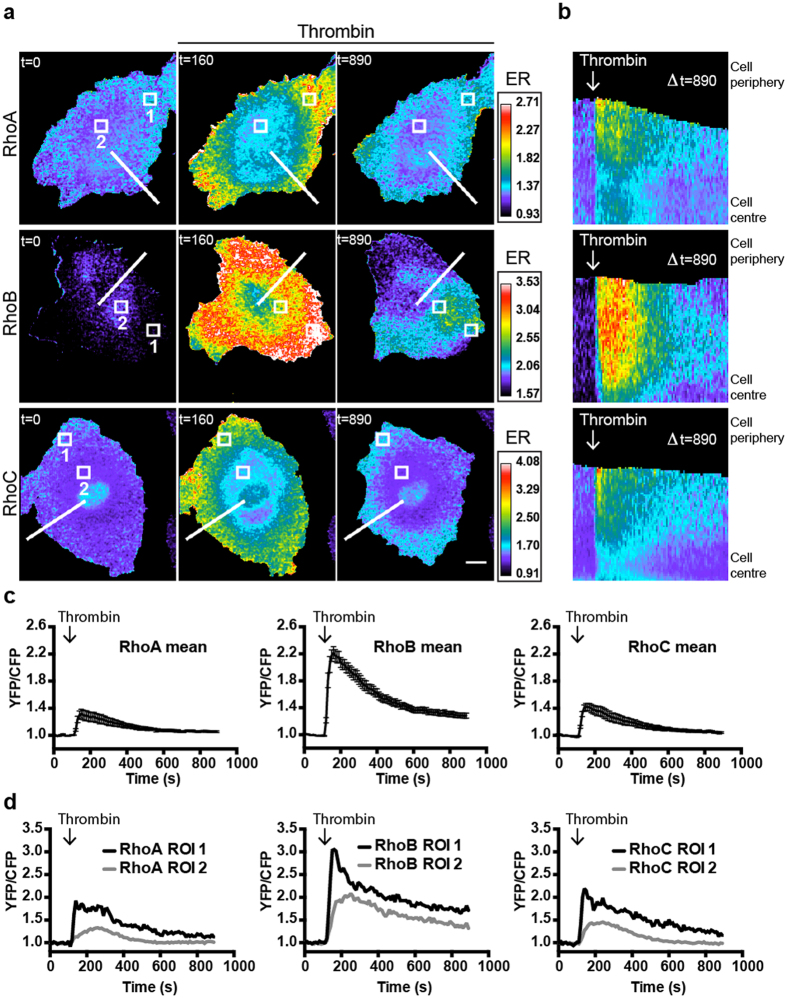
Figure 4. Thrombin induces RhoA/B/C activation in human EC.
(a) Ratiometric images of EC that were sequentially transfected with RhoA/B/C-WT FRET sensors and stimulated with Thrombin (1 U/ml) at t = 110. Warm colors represent high YFP/CFP ratios (Emission ratio (ER) on the right). Bar = 10 μm, t = in seconds. (b) Kymograph analysis of Thrombin stimulated RhoA/B/C-WT FRET sensors corresponding to the lines indicated in (a). (c) Normalized mean YFP/CFP ratio changes (±SEM) of the RhoA-WT (n = 13), RhoB-WT (n = 22) and RhoC-WT (n = 10) sensors after Thrombin stimulation at t = 110. (d) Normalized YFP/CFP ratio changes of localized RhoA/B/C activation in ROIs (Region Of Interest) indicated in (a).

