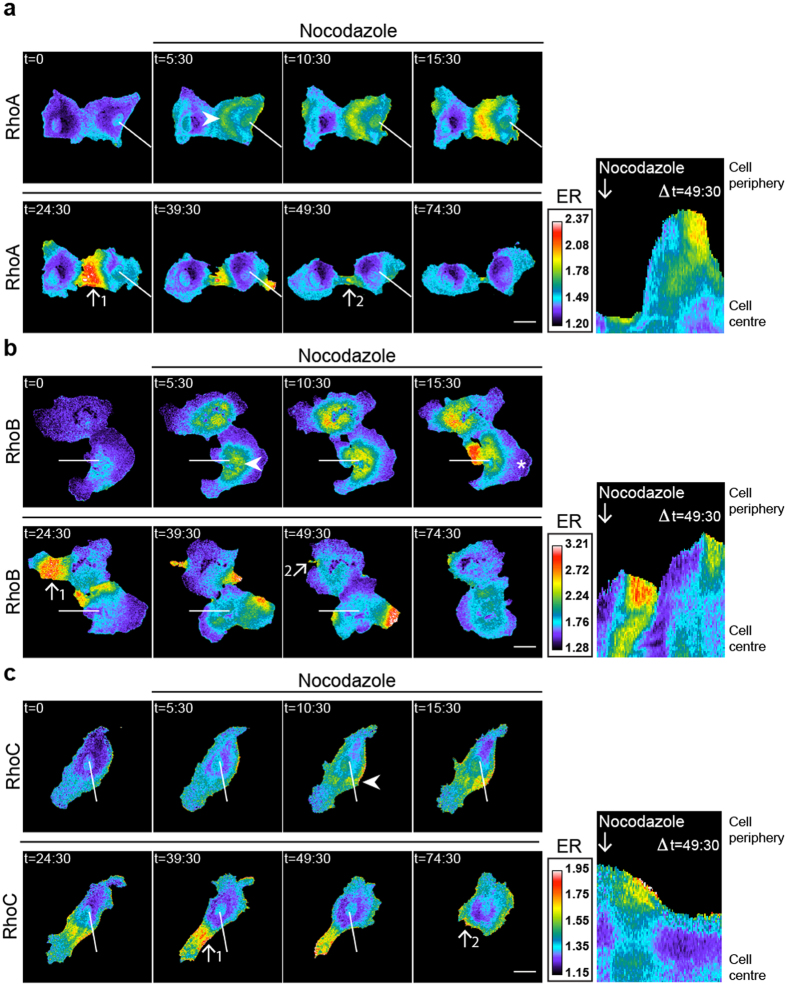
Figure 5. Nocodazole activates RhoA/B/C in spatial activation zones.
(a–c) Ratiometric images of EC that were sequentially transfected with RhoA/B/C-WT FRET sensors and stimulated with 5 μM Nocodazole at t = 3:00, t = in minutes. Warm colors represent high YFP/CFP ratios (Emission ratio (ER) on the right). Kymograph analysis is based on the indicated line and correspond to the time frame of in t = 0–49’:30”. Arrowheads indicate peripheral start activation for RhoA/C in (a,c) and perinuclear start activation for RhoB in (b). Arrows display pre-contractile, high activation (#1) and post-contractile, low activation (#2) zones in (a–c). Asterisk shows low RhoB activation in a protrusive area in (b). Bar = 25 μm.

