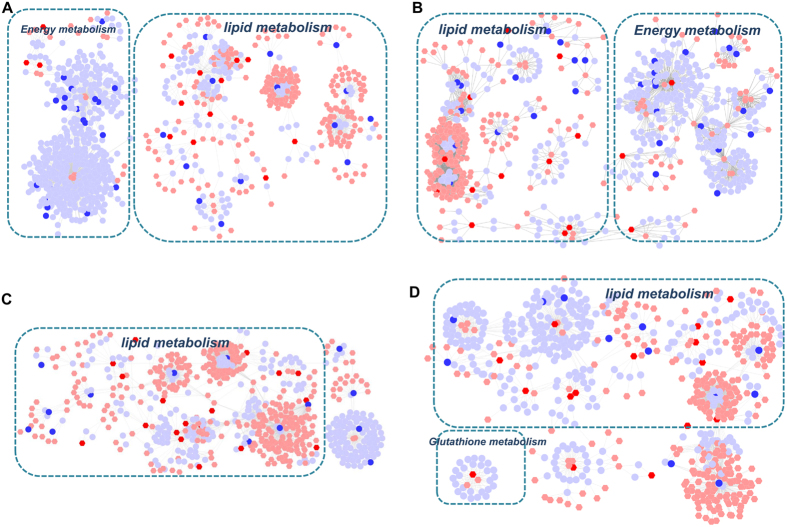
Figure 9. Metabolic correlation networks of the metabolites, genes and proteins regulated in lung tissues of chronic obstructive pulmonary disease (COPD) rats and Bufei Yishen formula (BYF)-treated rats.
Using Metscape, the compound reaction network with compounds (hexagons) and metabolic enzymes (rounds) as nodes and reactions as edges was constructed. Inputted genes and proteins were shown in red, inputted compounds were shown in blue. (A) Representative metabolites-gene network of COPD model group. (B) Representative metabolite-gene network of BYF-treated group. (C) Representative metabolites-protein network of COPD model group. (D) Representative metabolite-protein network of BYF-treated group.

