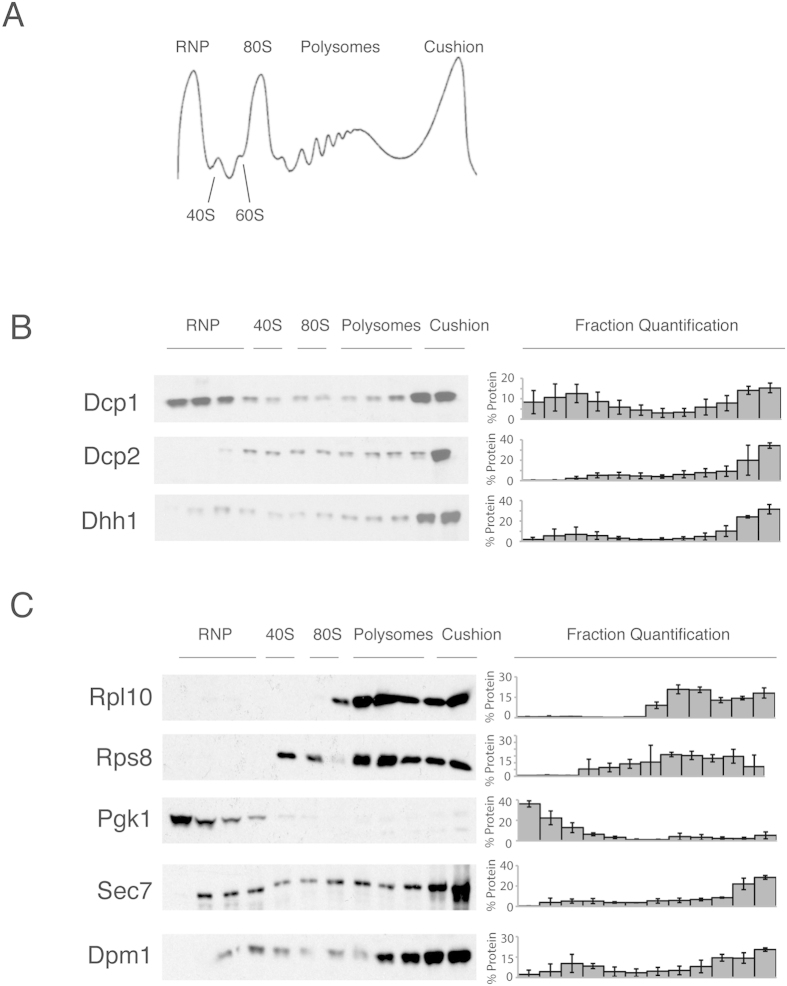
Figure 2. Sucrose gradient distribution of the mRNA decapping factors after ultracentrifugation.
(A) Typical polysome profile absorbance trace at 254 nm for a 15–50% sucrose gradient, indicating the ribonucleoprotein peak (RNP), ribosomal peaks (40S, 60S, 80S), polysomal peaks and the sucrose cushion peak. (B) Western blot analysis of the tagged mRNA decapping protein cell lysates from the 32–55% polysome profile gradient. The localisation of the RNP, 40S, 80S, polysome and cushion regions of the gradient is noted above the western blots. To the right of the blots is the percentage of protein found in each fraction, error = SD, n = 3. (C) The Western blot of the untagged cell lysates was probed for Rpl10 and Rps8 protein or lysates from yeast tagged with Pgk1, Sec7 and Dpm1. To the right of the blots is the percentage of the protein found in each fraction, error = SD, n = 3.

