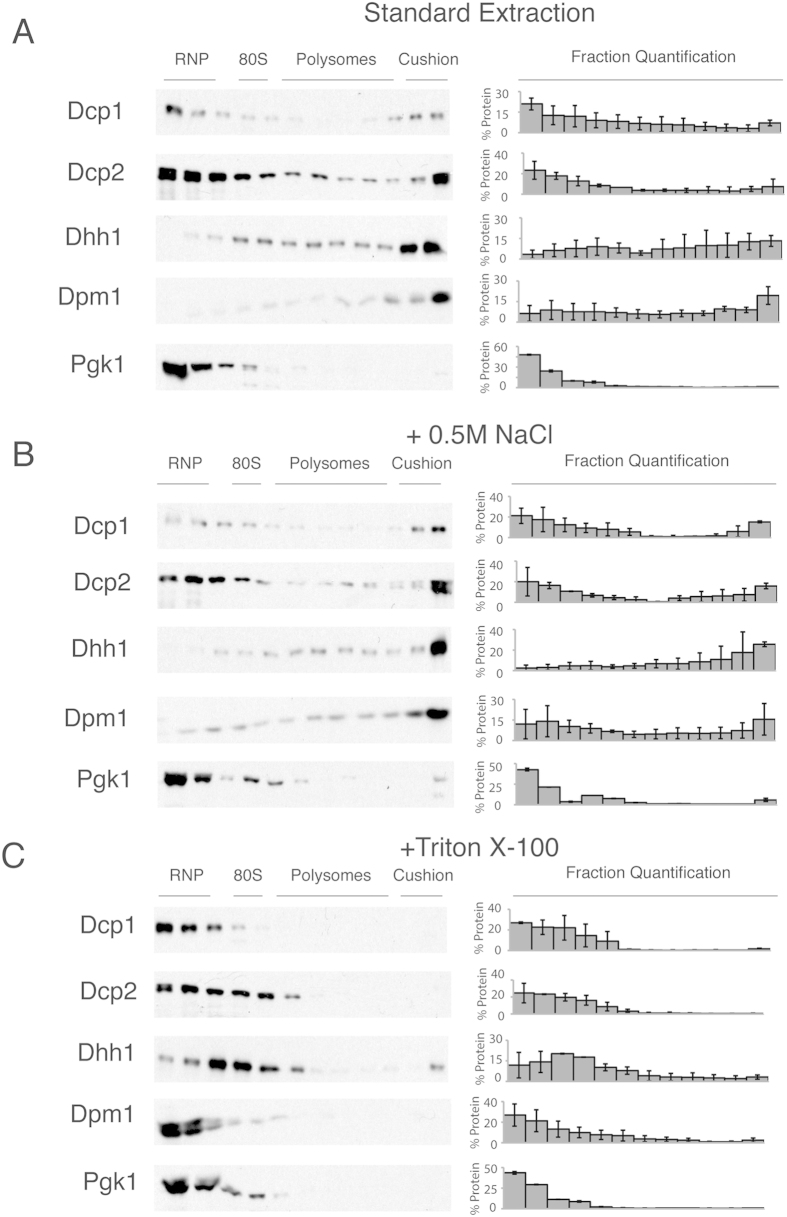
Figure 3. Distribution of the mRNA decapping factors separated on a sucrose gradient under different extraction conditions.
(A) Western blot analysis of the tagged mRNA decapping proteins from the cell lysate fractions from a 15–50% sucrose gradient. The localisation of the RNP, 40S, 80S, polysome and cushion regions of the gradient is noted above the western blots. To the right of the blots is the percentage of protein found in each fraction; error = SD; n = 3. (B) As in panel A, cells lysed with buffer containing 0.5 M NaCl. To the right of the blot is the percentage of protein found in each fraction; error = SD; n = 3. (C) Cells lysed with buffer containing 1% Triton X-100. To the right of the blot is the percentage of protein found in each fraction; error = SD; n = 3.

