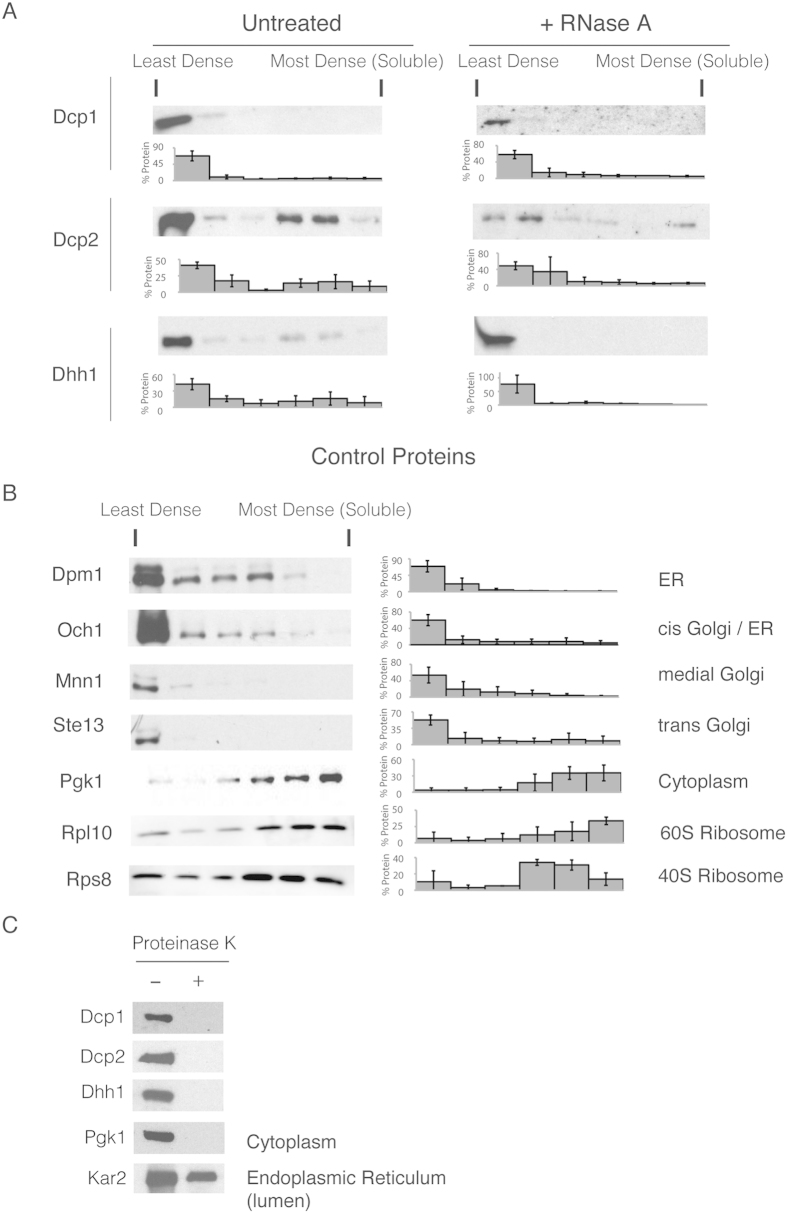
Figure 7. Buoyant density distribution of mRNA decapping factors and control proteins in flotation assays.
Western blots of fractions from the OptiPrep flotation assay of tagged (A) mRNA decapping proteins or (B) control proteins. To the far right of the western blots are the control proteins’ subcellular localisations. The less dense portion of the gradient is indicated by “Least dense”, and the dense bottom portion is labelled as “Most dense (soluble)”. To the immediate right of the western blots is the amount of protein in each fraction; error = SD; n = 3, except for Och1, Mnn1, and Ste13 where n = 2. (C) Yeast extracts of the indicated strains that expressed the C-terminal TAP tag fusions were incubated with lysis buffer (−) or digested with Proteinase K (+) for thirty minutes at room temperature.

