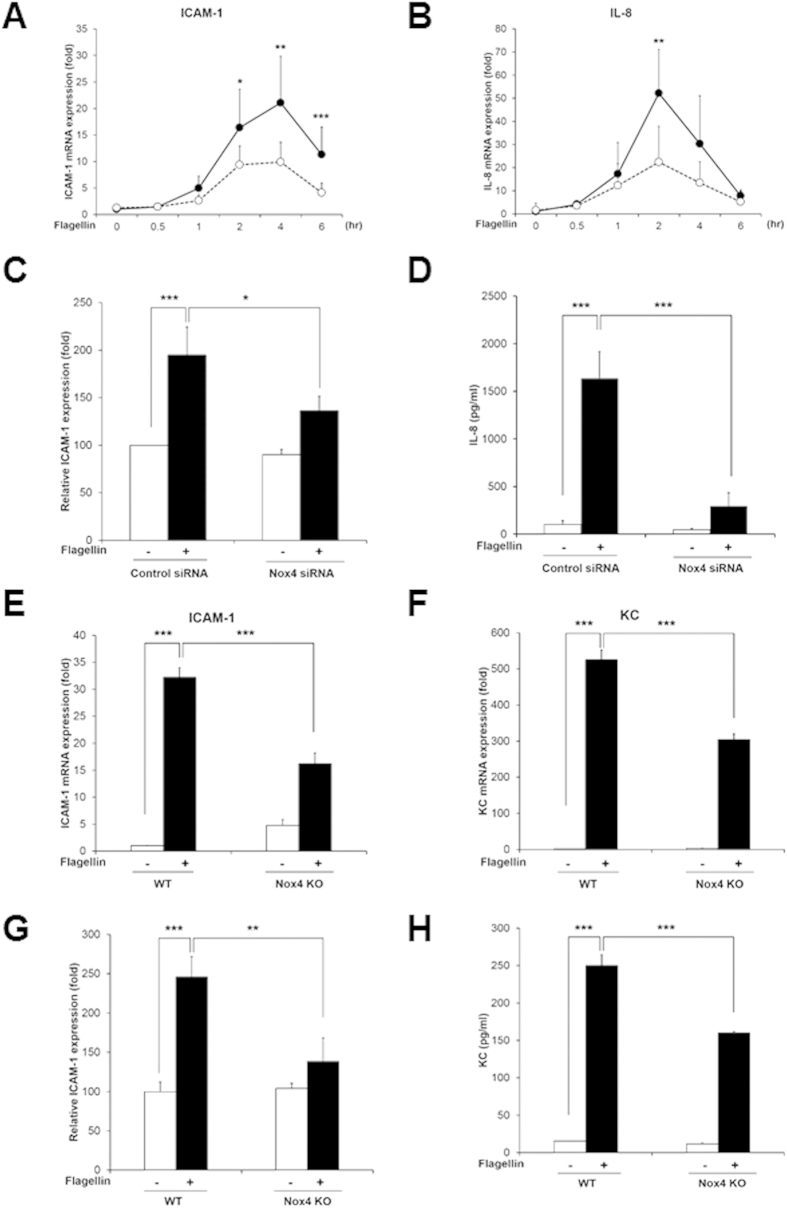
Figure 4. Nox4 regulates flagellin-induced ICAM-1 and IL-8 production.
(A) Quantification of ICAM-1 mRNA expression in HAECs (Comparison with Nox4 siRNA group, *p < 0.05, **p < 0.01 and ***p < 0.001, black circle; control siRNA, white circle; Nox4 siRNA). (B) Quantification of IL-8 mRNA expression in HAECs (Comparison with Nox4 siRNA group, **p < 0.01, black circle; control siRNA, white circle; Nox4 siRNA). (C) HAECs were stimulated with flagellin (100 ng/ml) for 16 hrs. The ICAM-1 protein expression level was determined by a flow cytometric analysis, and 10,000 cells were routinely analyzed in FACScalibur (N = 3, mean ± SD, *p < 0.05, ***p < 0.001). (D) HAECs were stimulated with flagellin (100 ng/ml) for 12 hrs. The IL-8 protein secretion was analyzed by ELISA (N = 3, mean ± SD, ***p < 0.001). MAECs from WT and Nox4 KO were stimulated with flagellin (100 ng/ml) for 2 hrs (E,F). (E) Quantification of ICAM-1 mRNA expression in MAECs (N = 5, mean ± SD, ***p < 0.001). (F) Quantification of KC mRNA expression in MAECs (N = 5, mean ± SD, ***p < 0.001). (G) MAECs from WT and Nox4 KO mice were stimulated with flagellin (100 ng/ml) for 16 hrs. The ICAM-1 protein expression level was determined by a flow cytometric analysis, and 10,000 cells were routinely analyzed in FACScalibur (N = 3, mean ± SD, **p < 0.01, ***p < 0.001). (H) MAECs from WT and Nox4 KO mice were stimulated with flagellin (100 ng/ml) for 12 hrs. The KC protein secretion was analyzed by ELISA (N = 3, mean ± SD, ***p < 0.001).

