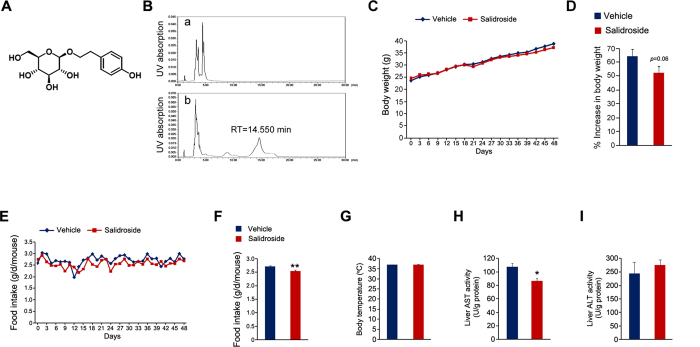
Figure 1. Salidroside administration reduces food intake in mice fed with high fat diet.
(A) Chemical structure of salidroside. (B) The plasma salidroside concentrations were analyzed by HPLC. The representative elution profiles of plasma from vehicle treated (a) or salidroside treated mice (b). RT: retention time. (C) Body weight during the treatment. (D) The percent increase (%) in body weight. (E-F) Food intake. (G) Body temperatures. (H) AST activities in liver. (I) ALT activities in liver. All values represent mean ± SEM with n = 5 from three independent experiments. All data were analyzed by Student’s t test. *p < 0.05, **p < 0.01.

