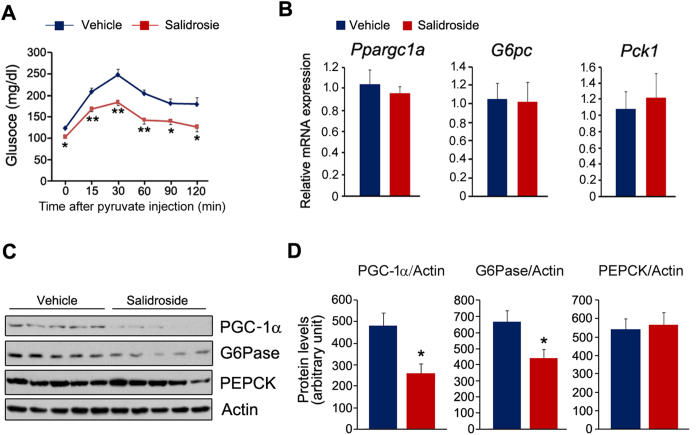
Figure 4. Salidroside treatment represses hepatic gluconeogenesis.
(A) Pyruvate tolerance test (PTT). (B) The expression of Ppargc1a, G6pc and Pck1. (C) The protein levels of PGC-1α, PEPCK and G6Pase. (D) Densitometric quantification of the immunoblot data in (C). The protein levels of PGC-1α, PEPCK and G6Pase were normalized to Actin. n = 5. All values represent mean ± SEM from three independent experiments. Data in (A) compared by two-way ANOVA analysis. Data in (D) were analyzed by Student’s t test. *p < 0.05, **p < 0.01.

