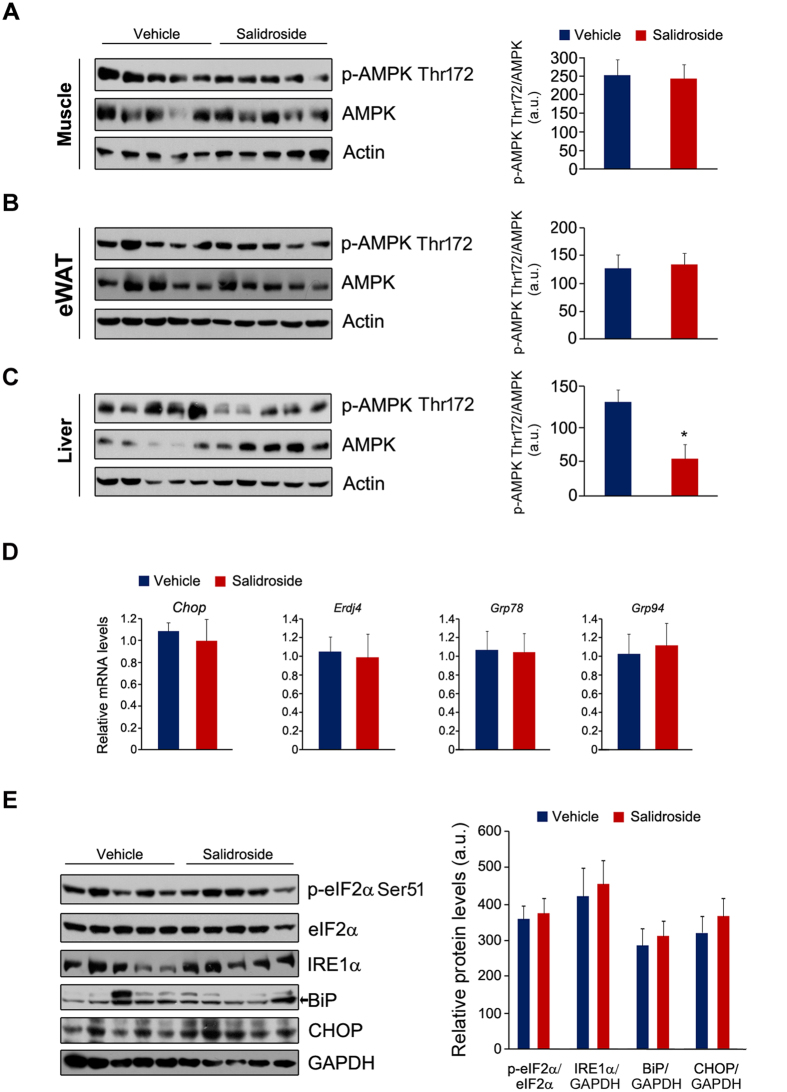
Figure 5. AMPK and unfold protein response (UPR) pathways were not affected by salidroside.
(A–C) The protein levels of p-AMPK and AMPK in the skeletal muscle (A), eWAT (B) and liver (C). (D) The chaperon gene expressions in the liver. (E) The protein levels of p-eIF2α, eIF2α, IRE1α, BiP and CHOP in the liver. GAPDH was used as loading control. The p-eIF2α levels were normalized to eIF2α. The protein levels of IRE1α, BiP and CHOP were normalized to GAPDH. eWAT: epididymal white adipose tissue. a.u. means arbitrary unit. n = 5. All values represent mean ± SEM from three independent experiments. All data were analyzed by Student’s t test. *p < 0.05.

