
Figure 3. Effect of curcumin on AT1R mRNA transcription.
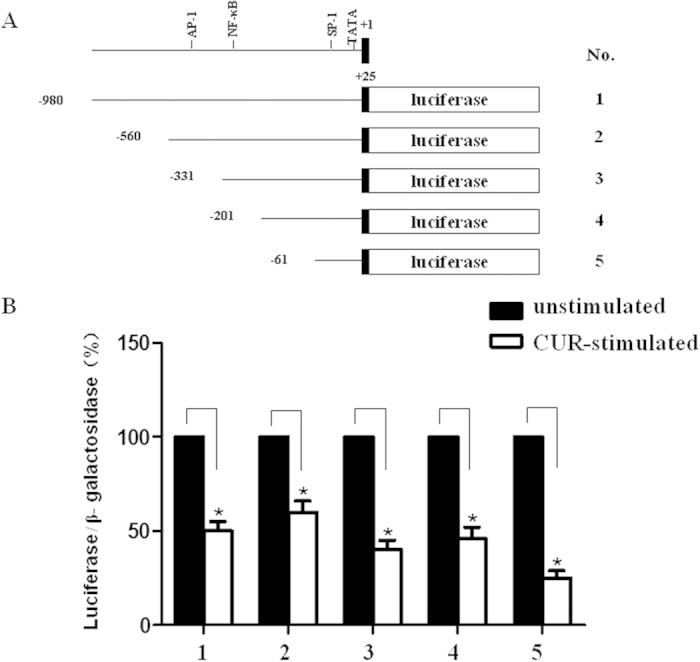
(A) Schematic of deletion mutants of the AT1R promoter/luciferase fusion DNA construct. (B) The bar graphs indicate luciferase activity normalized against β-galactosidase activity derived from the corresponding deletion. The data indicate the luciferase activity of curcumin-stimulated A10 cells (white bars) relative to unstimulated (black bars) in each group. The values (mean ± SEM) are expressed as a percent (*P < 0.05 vs. unstimulated, n = 6).