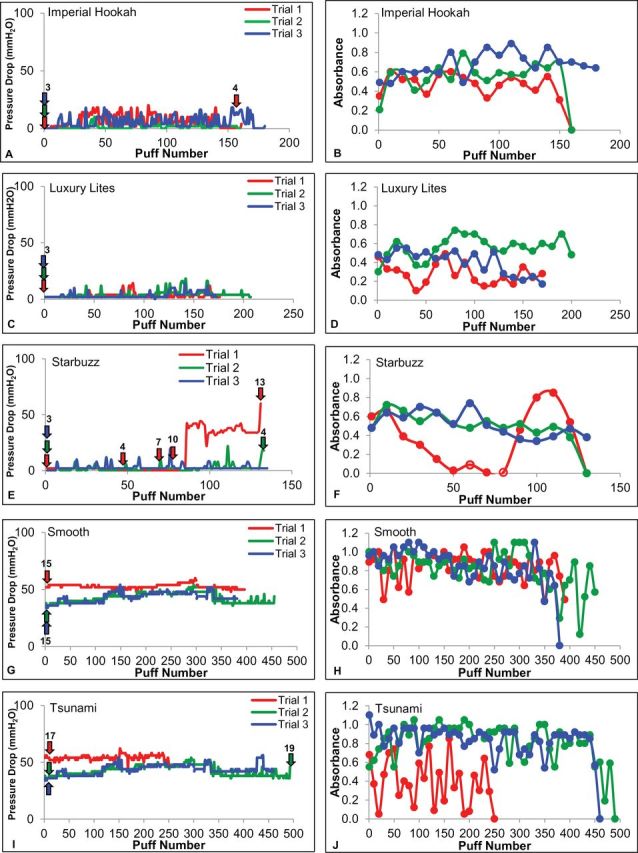
Figure 3.

Smoke-out results for five brands of disposable EH. (A–F) Button-activated models. (G–J) Airflow-activated models. (A, C, E, G, and I) Pressure drop is plotted versus puff number for five brands of disposable EH. Arrows in A, C, E, G, and I indicate starting airflow rates (mL/s) and increases in airflow rate that were needed to continue aerosol production. (B, D, F, H, and J) Aerosol absorbance is plotted versus puff number for the same five brands of EH. Open circles indicate puffs where airflow rate was increased to maintain aerosol production. Three different disposable units are shown for each brand.
