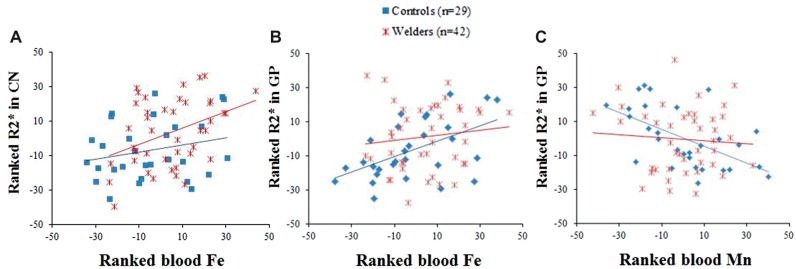
FIG. 3.
Scatter plots show (A) ranked R2* in the CN (y-axis) versus ranked blood iron (Fe: x-axis) for controls and welders; (B)ranked R2* in the GP (y-axis) versus ranked blood Fe (x-axis). R2* and blood Fe values were adjusted for age and whole Cu and Mn levels for (A) and (B); (C) ranked R2* in the GP (y-axis) and ranked blood Mn (x-axis). R2* and blood Mn values were adjusted for age and blood levels of Cu and Fe.

