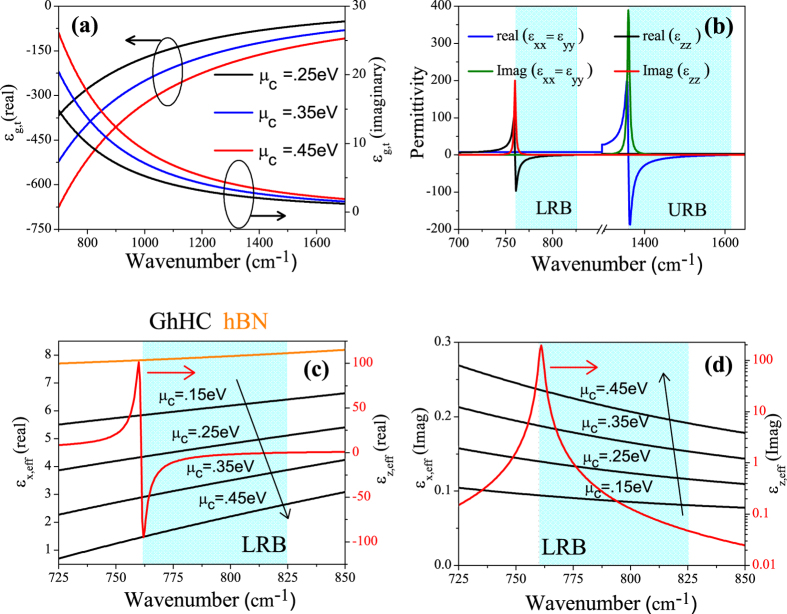
Figure 2.
(a) Real and imaginary part of the tangential permittivity of graphene as a function of wavenumber for various values of chemical potential of graphene with relaxation time, τ = 200 fs. (b) Real and imaginary part of the tangential and perpendicular permittivity of hBN. Shaded regions represent the lower and upper Reststrahlen bands (LRB and URB) (c) Real part of the effective tangential (black lines) and perpendicular (red line) permittivity of GhHC for different values of chemical potential of graphene. Real part of the tangential permittivity of hBN (orange line) is also shown for comparison as discussed in the text. (d) Imaginary part of the effective tangential (black lines) and perpendicular (red line) permittivity of GhHC for different values of chemical potential of graphene. Thickness of graphene and hBN in the unit cell, d1 = 1 nm and d2 = 100 nm respectively. Shaded region represents the lower Reststrahlen band (LRB).

