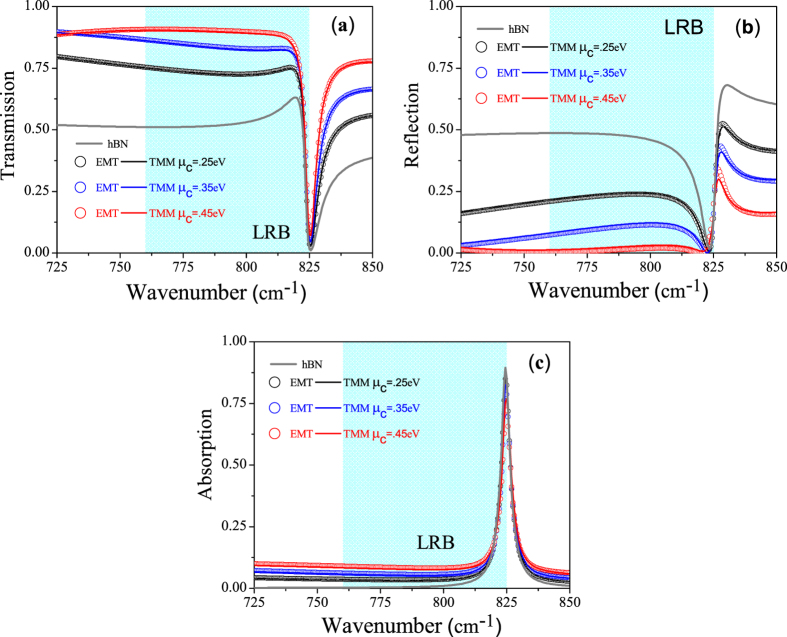
Figure 5.
(a) Transmission (b) reflection and (c) absorption coefficient of hBN and GhHC as a function of wavenumber with incidence angle 30°. The solid lines and symbols represent the calculated values for GhHC by the transfer matrix method (TMM) and effective medium theory, respectively, for different values of chemical potential of graphene (0.25 eV, 0.35 eV, 0.45 eV). The solid gray lines represent the calculated values of bare hBN. Total thickness of both bare hBN and GhHC d = ~1 μm, thickness of graphene and hBN in the unit cell, d1 = 1 nm and d2 = 100 nm respectively, total number of unit cell, N = 10 and the relaxation time of graphene, τ = 200 fs. Shaded region represents the lower Reststrahlen band (LRB).

