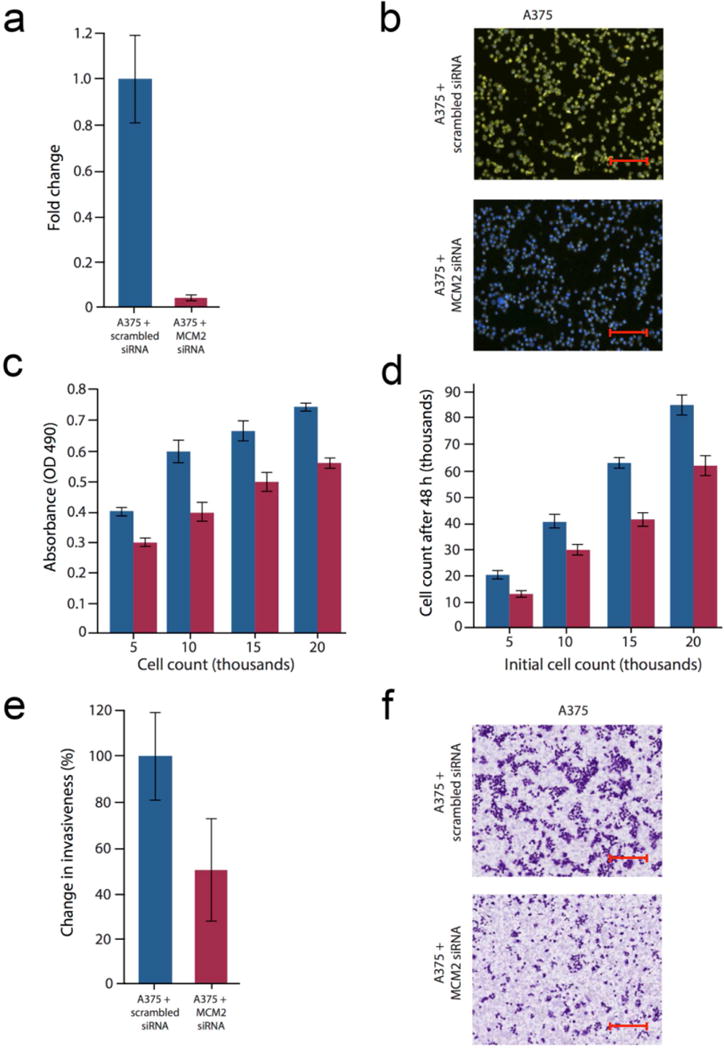
Figure 4. MCM2 knockdown on cell viability, growth, and invasiveness.

A375 cells transfected with an MCM2-specific siRNA and compared to scramble control siRNA. (a) qRT-PCR demonstrate the effect of MCM2-specific knockdown relative to scrambled control. (b) IHC staining of A375 cells using MCM2-specific antibodies. MCM2 staining shown in yellow (fluorescein isothiocyanate) and nuclei in blue (DAPI). Scale bar = 200 um. (c) Knockdown of MCM2 affects A375 cell viability (MTS assay). (d) Knockdown of MCM2 affects A375 cell number. (e) Knockdown of MCM2 suppresses A375 invasion. (f) Staining of A375 cells (crystal violet) 48 h after transfection with MCM2 siRNA reveals a decrease in cell invasion. All results are expressed as a mean±SD of three experiments. Scale bar = 200 um. Data for (a) and (e) were normalized to the scramble-transfected control.
