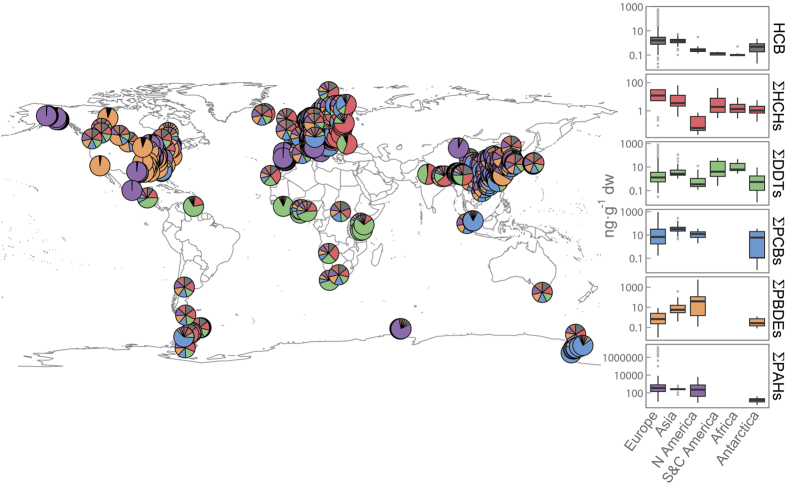
Figure 1. Continental distribution of POPs in vegetation around the globe.
The map shows the proportion of each family of compounds reviewed for all sampling locations with published data. The boxplots compare the concentrations of each family of POPs across continents. Interquartile ranges (25th and 75th percentile) are shown by the height of the boxes, and the horizontal lines represent medians (50th percentile). Whiskers range from the 10th to 90th percentiles. Concentrations are in ng·g−1 dry weight. The map was generated using the R packages rgdal60, maptools61, and mapplots62. Permission is granted to Nature Publishing Group to publish the image in all formats under an Open Access license.

